Concrete Strength Dataset - Regression
- Nov 2, 2021
- 1 min read

Description :
This dataset provides information about the compressive strength of concrete which is the most important material in civil engineering based on its components and its age.
Recommended Model :
Algorithms to be used: Regression, SVM, RandomForestRegressor etc.
Recommended Project :
Prediction of concrete compressive strength
Dataset link:
Overview of data
Detailed overview of dataset:
- Rows = 1030
- Columns= 9
Name -- Data Type -- Measurement -- Description
Cement (component 1) : quantitative -- kg in a m3 mixture -- Input Variable
Blast Furnace Slag (component 2): quantitative -- kg in a m3 mixture -- Input Variable
Fly Ash (component 3): quantitative -- kg in a m3 mixture -- Input Variable
Water (component 4): quantitative -- kg in a m3 mixture -- Input Variable
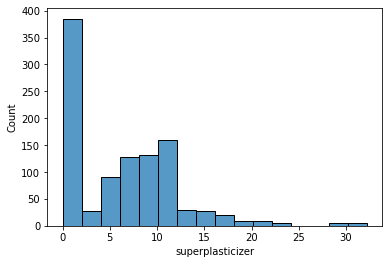
Superplasticizer (component 5): quantitative -- kg in a m3 mixture -- Input Variable
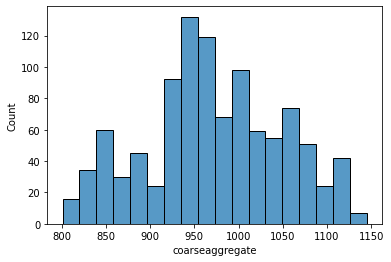
Coarse Aggregate (component 6): quantitative -- kg in a m3 mixture -- Input Variable
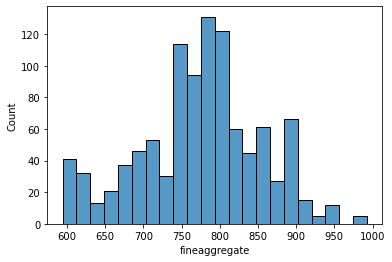
Fine Aggregate (component 7): quantitative -- kg in a m3 mixture -- Input Variable
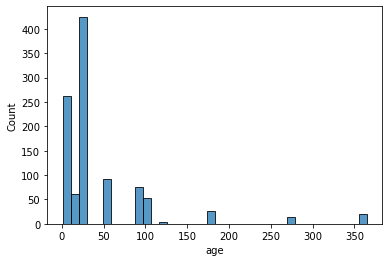
Age: quantitative -- Day (1~365) -- Input Variable
Concrete compressive strength: quantitative -- MPa -- Output Variable
EDA [CODE]
import pandas as pd
# load data data = pd.read_csv('Concrete_Data_Yeh.csv')
data.head()
# check details of the dataframe
data.info()
# check the no.of missing values in each column
data.isna().sum()
# statistical information about the dataset
data.describe()
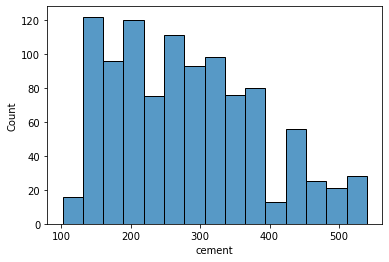
# data distribution
import seaborn as sns
import matplotlib.pyplot as plt
sns.histplot(data['cement'], kde=False)
plt.show()
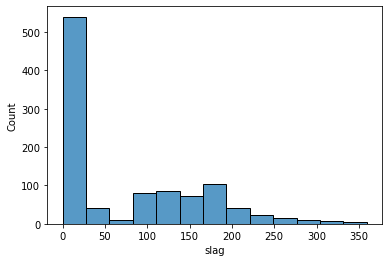
sns.histplot(data['slag'], kde=False)
plt.show()
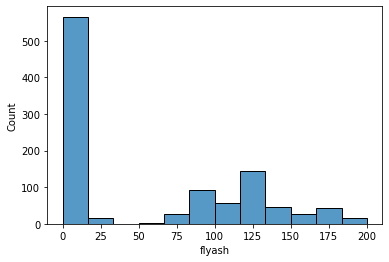
sns.histplot(data['flyash'], kde=False)
plt.show()
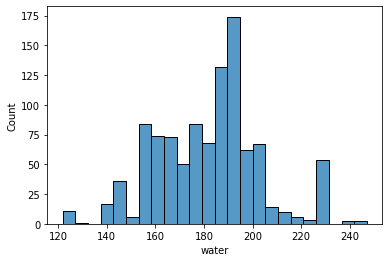
sns.histplot(data['water'], kde=False)
plt.show()
sns.histplot(data['superplasticizer'], kde=False)
plt.show()
sns.histplot(data['coarseaggregate'], kde=False)
plt.show()
sns.histplot(data['fineaggregate'], kde=False)
plt.show()
sns.histplot(data['age'], kde=False)
plt.show()
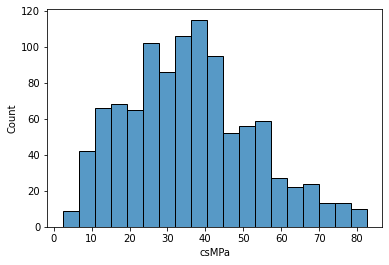
sns.histplot(data['csMPa'], kde=False)
plt.show()


Other datasets for classification:
If you need implementation for any of the topics mentioned above or assignment help on any of its variants, feel free to contact us


Comments