Medical Cost Personal Dataset - Regression
- Nov 2, 2021
- 3 min read
Updated: May 19
Need Help Implementing Medical Cost Prediction? Get Expert Data Science Assignment Help

Description :
This dataset explains the cost of a small sample of USA population Medical Insurance Cost based on some attributes such as age, sex, bmi etc.
This dataset corresponds to a practical used in the book Machine Learning with R by Brett Lantz; which is a book that provides an introduction to machine learning using R. All of these datasets are in the public domain but simply needed some cleaning up and recoding to match the format in the book.
Recommended Model :
Algorithms to be used: Regression, SVM, RandomForestRegressor etc.
Recommended Project :
Medical Insurance Cost Prediction
Dataset link:
Overview of data
Detailed overview of dataset:
- Rows = 1338
- Columns= 7
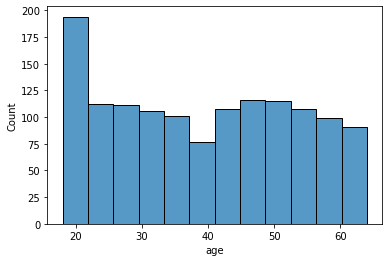
age: age of primary beneficiary
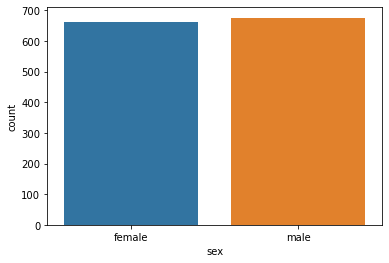
sex: insurance contractor gender, female, male
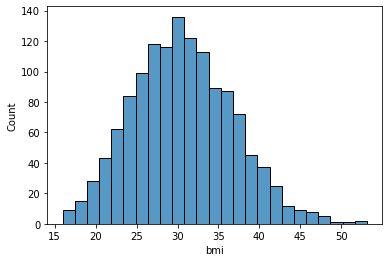
bmi: Body mass index, providing an understanding of body, weights that are relatively high or low relative to height, objective index of body weight (kg / m ^ 2) using the ratio of height to weight, ideally 18.5 to 24.9
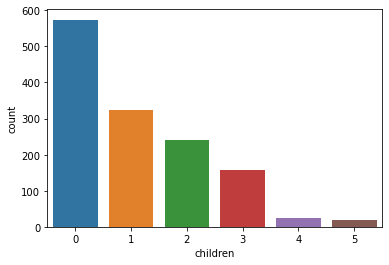
children: Number of children covered by health insurance / Number of dependents
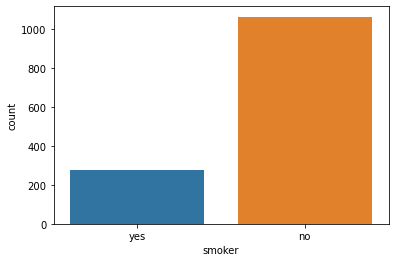
smoker: Smoking
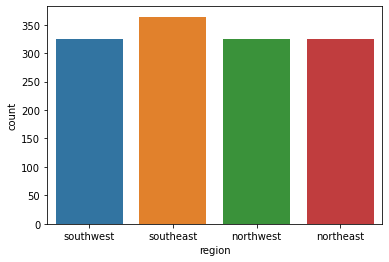
region: the beneficiary's residential area in the US, northeast, southeast, southwest, northwest.
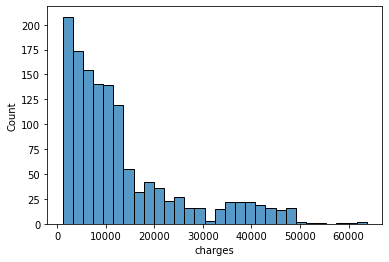
charges: Individual medical costs billed by health insurance
Full implementation available on GitHub → medical_cost_regression.py The code below covers EDA, feature engineering, model training, and evaluation.
EDA [CODE]
import pandas as pd
# load data data = pd.read_csv('insurance.csv')
data.head()
# check details of the dataframe
data.info()
# check the no.of missing values in each column
data.isna().sum()

# statistical information about the dataset
data.describe()
# data distribution

import seaborn as sns
import matplotlib.pyplot as plt

sns.countplot(x='sex', data=data)
plt.show()

sns.countplot(x='children', data=data)
plt.show()

sns.countplot(x='smoker', data=data)
plt.show()

sns.countplot(x='region', data=data)
plt.show()

sns.histplot(data['age'], kde=False)
plt.show()

sns.histplot(data['bmi'], kde=False)
plt.show()

sns.histplot(data['charges'], kde=False)
plt.show()


FAQ
Q1: What is the Medical Cost Personal Dataset?
The Medical Cost Personal Dataset contains 1,338 records of US health insurance beneficiaries with 7 attributes — age, sex, BMI, number of children, smoking status, region, and individual medical charges. It is widely used to practice regression modelling in machine learning and originates from the book Machine Learning with R by Brett Lantz. The dataset is publicly available on Kaggle.
Q2: Which machine learning algorithm works best for medical cost prediction?Random Forest and XGBoost consistently outperform linear models on this dataset because the relationship between features and charges is non-linear — especially the interaction between smoking status and BMI. In standard benchmarks, XGBoost achieves an R² score above 0.87, compared to around 0.74 for Linear Regression.
Q3: How do I handle categorical variables in the insurance dataset?
Three columns need encoding before modelling:
sex and smoker — use LabelEncoder (binary values)
region — use pd.get_dummies() with drop_first=True to avoid multicollinearity
Additionally, creating a smoker_obese interaction feature (smoker AND BMI ≥ 30) significantly improves model accuracy.
Q4: What are the most important features for predicting insurance charges?
Based on feature importance from tree-based models:
smoker — by far the strongest predictor
age — positive linear relationship with charges
bmi — particularly impactful above the obesity threshold (≥ 30)
smoker_obese interaction — captures the highest-cost patient segment
children, region, and sex have relatively minor effects
Q5: What evaluation metrics should I use for regression on this dataset?
Use all three together for a complete picture:
MAE (Mean Absolute Error) — average dollar error in predictions
RMSE (Root Mean Squared Error) — penalises large errors more heavily
R² Score — proportion of variance explained (closer to 1.0 is better)
Relying on R² alone is misleading; always check RMSE to understand real-world prediction error in dollar terms.
Q6: Where can I find the full Python source code for this project? The complete implementation — including EDA, feature engineering, model training, cross-validation, and sample prediction — is available on GitHub:github.com/CodersArts/Machine-Learning/blob/main/Regression/medical_cost_regression.py
Q7: Can I get help implementing this or a similar machine learning project? Yes. Codersarts provides expert help for machine learning assignments, data science projects, and end-to-end code implementation. For students and professionals who want to go beyond assignments and build a deployable product, Codersarts Labs offers 250+ guided ML project tracks built with experienced engineers. → Get Machine Learning Assignment Help
📂 View complete source code on GitHub
💡 Need this implemented for your dataset? → codersarts.com/machine-learning-assignment-help
🚀 Build a real ML product end-to-end → labs.codersarts.com
Other datasets for classification:
🔬 Working on a similar ML project? Get expert help from Codersarts — we implement machine learning assignments, data science projects, and regression models end-to-end. 👉 Get Machine Learning Assignment Help

Want to turn this into a real product? Medical cost prediction is just one of 300+ project ideas on Codersarts Labs — where you build end-to-end products with experienced engineers, not just tutorials. 👉 Explore ML Product Ideas on Codersarts Labs →


Comments