Avocado Prices Dataset - Regression
- Nov 2, 2021
- 2 min read
Updated: Nov 3, 2021

Description :
This dataset provides information about weekly 2018 retail scan data for National retail volume (units) and price. Retail scan data comes directly from retailers’ cash registers based on actual retail sales of Hass avocados. Starting in 2013, the data reflects an expanded, multi-outlet retail data set. Multi-outlet reporting includes an aggregation of the following channels: grocery, mass, club, drug, dollar and military. The Average Price (of avocados) in the data reflects a per unit (per avocado) cost, even when multiple units (avocados) are sold in bags. The Product Lookup codes (PLU’s) in the data are only for Hass avocados. Other varieties of avocados (e.g. greenskins) are not included in this table.
Recommended Model :
Algorithms to be used: Regression, SVM, RandomForestRegressor, Time series analysis etc.
Recommended Project :
Avocado Price Prediction
Dataset link:
Overview of data
Detailed overview of dataset:
- Rows = 18249
- Columns= 13
Date: The date of the observation
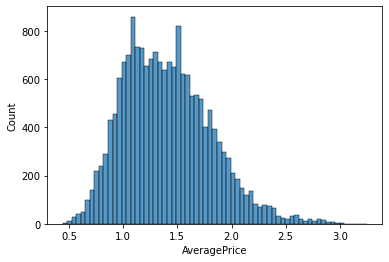
AveragePrice: the average price of a single avocado
type: conventional or organic
year: the year
Region: the city or region of the observation
Total Volume: Total number of avocados sold
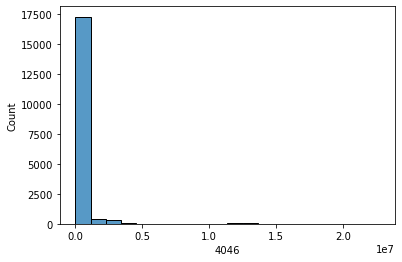
4046: Total number of avocados with PLU 4046 sold
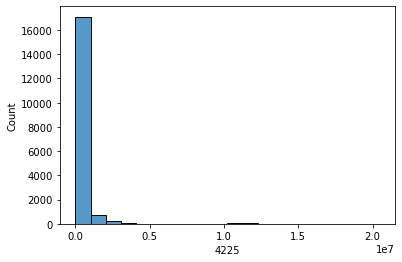
4225: Total number of avocados with PLU 4225 sold
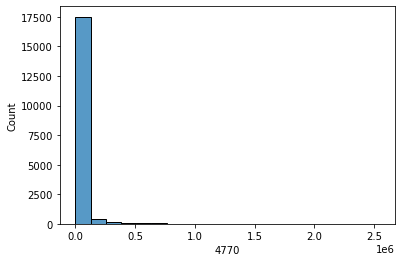
4770: Total number of avocados with PLU 4770 sold
This data was downloaded from the Hass Avocado Board website in May of 2018 & compiled into a single CSV.
EDA [CODE]
import pandas as pd
# load data data = pd.read_csv('avocadocsv')
data.head()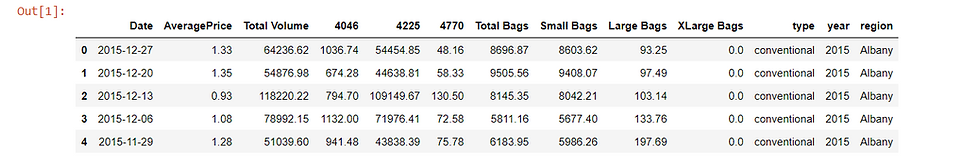
# check details of the dataframe
data.info()
# check the no.of missing values in each column
data.isna().sum()
# statistical information about the dataset
data.describe()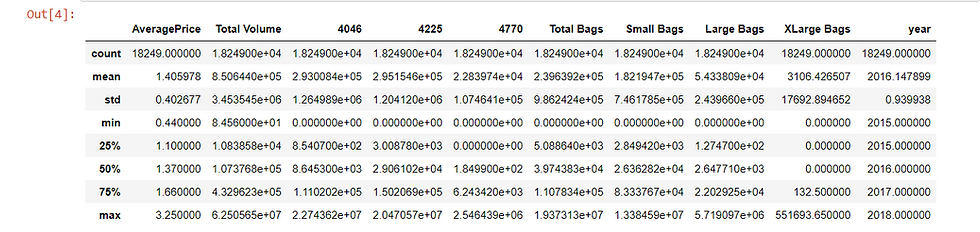
# data distribution
import seaborn as sns
import matplotlib.pyplot as plt
sns.countplot(x='v1', data=data)
plt.show()
#Adding new feature 'message_length'
data['message_length'] = data['v2'].apply(lambda x: len(x.split(" ")))
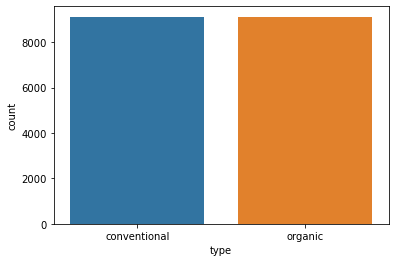
sns.countplot(x='type', data=data)
plt.show()
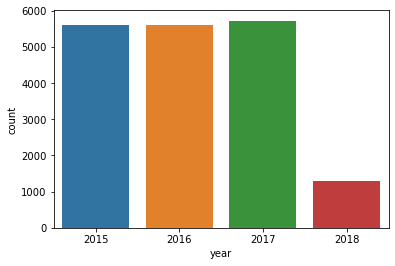
sns.countplot(x='year', data=data)
plt.show()
sns.histplot(data['AveragePrice'], kde=False)
plt.show()
sns.histplot(data['Total Volume'], bins = 20, kde= False)
plt.show()
sns.histplot(data['4046'], bins = 20, kde=False)
plt.show()
sns.histplot(data['4225'], bins = 20, kde=False)
plt.show()
sns.histplot(data['4770'], bins = 20, kde=False)
plt.show()
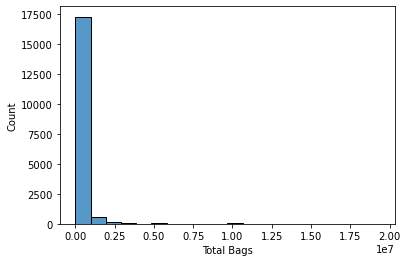
sns.histplot(data['Total Bags'], bins = 20, kde=False)
plt.show()
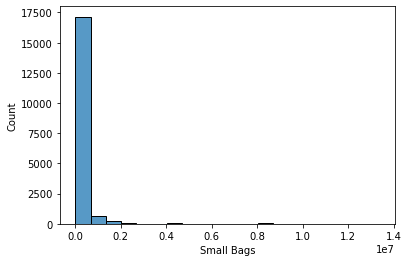
sns.histplot(data['Small Bags'], bins = 20, kde=False)
plt.show()
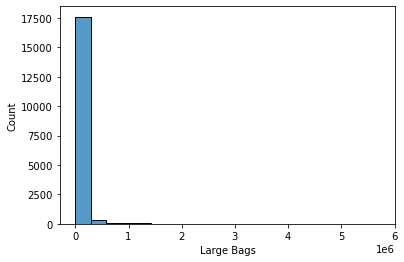
sns.histplot(data['Large Bags'], bins = 20, kde=False)
plt.show()
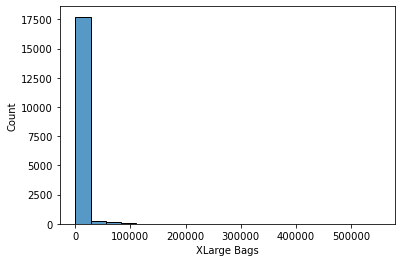
sns.histplot(data['XLarge Bags'], bins = 20, kde=False)
plt.show()


Other datasets for classification:
If you need implementation for any of the topics mentioned above or assignment help on any of its variants, feel free to contact us.


Comments