Red Wine Quality Dataset - Classification
- Oct 27, 2021
- 3 min read
Updated: Nov 1, 2021

Description :
This dataset provides information about the red wine samples from the north of Portugal to model red wine quality based on physicochemical tests.
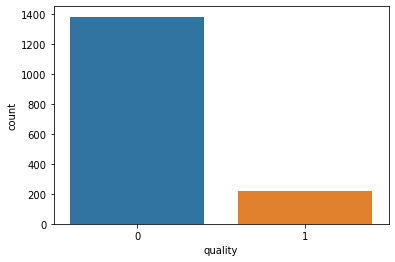
We can use this dataset for regression as well as classification. The classes are ordered and not balanced (e.g. there are much more normal wines than excellent or poor ones). In order to use it for classification, all you need to do is to set an arbitrary cutoff for your dependent variable (wine quality) at e.g. 7 or higher getting classified as 'good/1' and the remainder as 'not good/0'.
Knowing how each variable will impact the red wine quality will help producers, distributors, and businesses in the red wine industry better assess their production, distribution, and pricing strategy.
Recommended Model :
Algorithms to be used: decision tree, random forest, svm, logistic regression, KNN etc
Recommended Project :
Red Wine Quality prediction
Dataset link:
https://www.kaggle.com/uciml/red-wine-quality-cortez-et-al-2009
Overview of data
Detailed overview of dataset:
- Rows = 1599
- Columns= 12
fixed acidity (tartaric acid - g / dm^3) : most acids involved with wine or fixed or nonvolatile (do not evaporate readily).
volatile acidity (acetic acid - g / dm^3): the amount of acetic acid in wine, which at too high of levels can lead to an unpleasant, vinegar taste.
citric acid (g / dm^3): found in small quantities, citric acid can add 'freshness' and flavor to wines.
residual sugar (g / dm^3): the amount of sugar remaining after fermentation stops, it's rare to find wines with less than 1 gram/liter and wines with greater than 45 grams/liter are considered sweet.
chlorides (sodium chloride - g / dm^3): the amount of salt in the wine.
free sulfur dioxide (mg / dm^3): the free form of SO2 exists in equilibrium between molecular SO2 (as a dissolved gas) and bisulfite ion; it prevents microbial growth and the oxidation of wine.
total sulfur dioxide (mg / dm^3): amount of free and bound forms of S02; in low concentrations, SO2 is mostly undetectable in wine, but at free SO2 concentrations over 50 ppm, SO2 becomes evident in the nose and taste of wine.
density (g / cm^3): the density of water is close to that of water depending on the percent alcohol and sugar content.
pH: describes how acidic or basic a wine is on a scale from 0 (very acidic) to 14 (very basic); most wines are between 3-4 on the pH scale.
sulphates (potassium sulphate - g / dm3): a wine additive which can contribute to sulfur dioxide gas (S02) levels, wich acts as an antimicrobial and antioxidant.
alcohol (% by volume): the percent alcohol content of the wine.
quality: score either good (1) or bad (0)
EDA [CODE]
import pandas as pd
# load data data = pd.read_csv('train.csv')
data.head()
# check details of the dataframe
data.info()
# check the no.of missing values in each column
data.isna().sum()
# statistical information about the dataset
data.describe()
# making the quality column binary

def convert(val):
    if val >= 7:
        return 1
    else:
        return 0

data['quality'] = data['quality'].apply(convert)


# data distribution

import seaborn as sns
import matplotlib.pyplot as plt

sns.countplot(x='quality', data=data)
plt.show()

fig = sns.FacetGrid(data, col='quality', hue='quality', height=4)
fig.map(sns.histplot, 'fixed acidity', bins=30, kde=False)
plt.show()

fig = sns.FacetGrid(data, col='quality', hue='quality', height=4)
fig.map(sns.histplot, 'volatile acidity', bins=30, kde=False)
plt.show()

fig = sns.FacetGrid(data, col='quality', hue='quality', height=4)
fig.map(sns.histplot, 'citric acid', bins=30, kde=False)
plt.show()

fig = sns.FacetGrid(data, col='quality', hue='quality', height=4)
fig.map(sns.histplot, 'residual sugar', bins=30, kde=False)
plt.show()

fig = sns.FacetGrid(data, col='quality', hue='quality', height=4)
fig.map(sns.histplot, 'chlorides', bins=30, kde=False)
plt.show()

fig = sns.FacetGrid(data, col='quality', hue='quality', height=4)
fig.map(sns.histplot, 'free sulfur dioxide', bins=30, kde=False)
plt.show()

fig = sns.FacetGrid(data, col='quality', hue='quality', height=4)
fig.map(sns.histplot, 'total sulfur dioxide', bins=30, kde=False)
plt.show()

fig = sns.FacetGrid(data, col='quality', hue='quality', height=4)
fig.map(sns.histplot, 'density', bins=30, kde=False)
plt.show()

fig = sns.FacetGrid(data, col='quality', hue='quality', height=4)
fig.map(sns.histplot, 'pH', bins=30, kde=False)
plt.show()

fig = sns.FacetGrid(data, col='quality', hue='quality', height=4)
fig.map(sns.histplot, 'sulphates', bins=30, kde=False)
plt.show()

fig = sns.FacetGrid(data, col='quality', hue='quality', height=4)
fig.map(sns.histplot, 'alcohol', bins=30, kde=False)
plt.show()


Other datasets for classification:
If you need implementation for any of the topics mentioned above or assignment help on any of its variants, feel free to contact us.


Comments