Titanic Survival Dataset - Classification
- Oct 27, 2021
- 2 min read
Updated: Nov 1, 2021
Description :
This dataset provides information on the fate of passengers on the Titanic, summarized according to economic status (class), sex, age and survival. This dataset can be used for classifying passengers into two groups based on whether they survived or not.
Recommended Model :
Algorithms to be used: random forest, svm, logistic regression etc
Recommended Project :
Titanic survival prediction
Dataset link:
https://www.kaggle.com/c/titanic/data
Overview of data
Detailed overview of dataset:
- Rows = 1309 ( train set: 891, test set: 418)
- Columns= 1 2
PassengerId: Passenger identification number
Survival : Passenger's survival (0= No; 1 = Yes)
Pclass: Passenger's Class (1 = 1st; 2 = 2nd; 3 = 3rd)
name: Passenger's Name
sex: Passenger's Sex
age: Passenger's Age
sibsp: Number of Siblings/Spouses Aboard
parch: Number of Parents/Children Aboard
ticket: Ticket Number
fare: Passenger's Fare (British pound)
cabin: Cabin
embarked: Port of Embarkation (C = Cherbourg; Q = Queenstown; S = Southampton)
NOTE:
pclass: A proxy for socio-economic status (SES):
1st = Upper
2nd = Middle
3rd = Lower
age: Age is fractional if less than 1. If the age is estimated, it is in the form of xx.5
sibsp: The dataset defines family relations in this way:
Sibling = brother, sister, stepbrother, stepsister
Spouse = husband, wife (mistresses and fiancés were ignored)
parch: The dataset defines family relations in this way:
Parent = mother, father
Child = daughter, son, stepdaughter, stepson
Some children travelled only with a nanny, therefore parch=0 for them.
EDA [CODE]
import pandas as pd

# load data
data = pd.read_csv('train.csv')
data.head()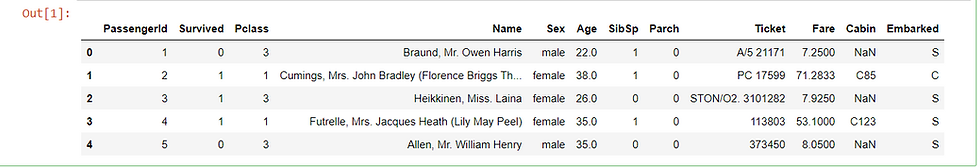
# check details of the dataframe
data.info()
# check the no. of missing values in each column
data.isna().sum()
# statistical information about the dataset
data.describe()
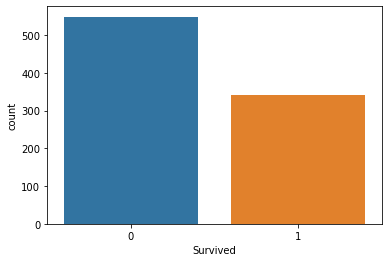
# data distribution
import seaborn as sns
import matplotlib.pyplot as plt
sns.countplot(x='Survived', data=data)
plt.show()
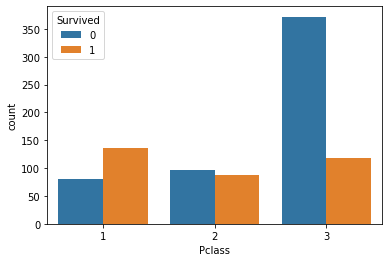
sns.countplot(x='Pclass', hue='Survived', data=data)
plt.show()
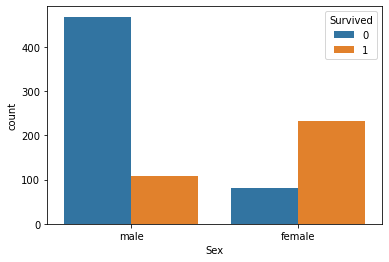
sns.countplot(x='Sex', hue='Survived', data=data)
plt.show()
fig = sns.FacetGrid(data, col='Survived', hue='Survived', height=4)
fig.map(sns.histplot, 'Age', bins=30, kde=False)
plt.show()
fig = sns.FacetGrid(data, col='Survived', hue='Survived', height=4)
fig.map(sns.histplot, 'Fare', bins=30, kde=False)
plt.show()
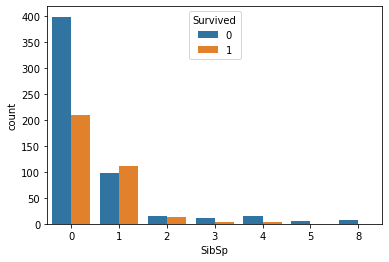
sns.countplot(x='SibSp',hue='Survived', data=data)
plt.show()
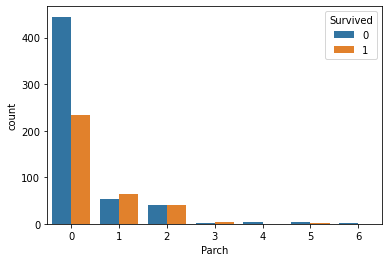
sns.countplot(x='Parch',hue='Survived', data=data)
plt.legend(title='Survived' ,loc='upper right')
plt.show()
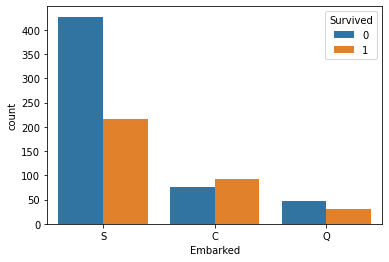
sns.countplot(x='Embarked', hue='Survived', data=data)
plt.show()


Other datasets for classification:
If you need implementation for any of the topics mentioned above or assignment help on any of its variants, feel free to contact us.


Comments