Pima Indians Diabetes Dataset - Classificaation
- Nov 1, 2021
- 2 min read

Description :
This dataset is originally from the National Institute of Diabetes and Digestive and Kidney Diseases. The objective of the dataset is to diagnostically predict whether or not a patient has diabetes, based on certain diagnostic measurements included in the dataset. Several constraints were placed on the selection of these instances from a larger database. In particular, all patients here are females at least 21 years old of Pima Indian heritage.
The datasets consists of several medical predictor variables and one target variable, Outcome. Predictor variables includes the number of pregnancies the patient has had, their BMI, insulin level, age, and so on.
Recommended Model :
Algorithms to be used: Naïve Bayes, Decision tree, Random forest, SVM, XGBoost, LSTM etc.
Recommended Project :
Predicting whether or not a patient has Diabetes
Dataset link:
Overview of data
Detailed overview of dataset:
- Rows = 768
- Columns= 9
Pregnancies: Number of times pregnant
Glucose: Plasma glucose concentration a 2 hours in an oral glucose tolerance test
BloodPressure: Diastolic blood pressure (mm Hg)
SkinThickness: Triceps skin fold thickness (mm)
Insulin: 2-Hour serum insulin (mu U/ml)
BMI: Body mass index (weight in kg/(height in m)^2)
DiabetesPedigreeFunction: Diabetes pedigree function
Age: Age (years)
Outcome: Class variable (0 or 1)
EDA [CODE]
import pandas as pd
# load data data = pd.read_csv('diabetes.csv')
data.head()
# check details of the dataframe
data.info()
# check the no.of missing values in each column
data.isna().sum()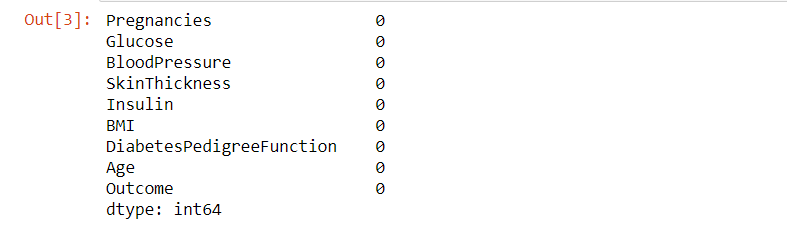
# statistical information about the dataset
data.describe()
# data distribution

import seaborn as sns
import matplotlib.pyplot as plt

sns.countplot(x='Outcome', data=data)
plt.show()

fig = sns.FacetGrid(data, col='Outcome', hue='Outcome', height=4)
fig.map(sns.histplot, 'Pregnancies', bins=30, kde=False)
plt.show()

fig = sns.FacetGrid(data, col='Outcome', hue='Outcome', height=4)
fig.map(sns.histplot, 'Glucose', bins=30, kde=False)
plt.show()

fig = sns.FacetGrid(data, col='Outcome', hue='Outcome', height=4)
fig.map(sns.histplot, 'BloodPressure', bins=30, kde=False)
plt.show()

fig = sns.FacetGrid(data, col='Outcome', hue='Outcome', height=4)
fig.map(sns.histplot, 'SkinThickness', bins=30, kde=False)
plt.show()

fig = sns.FacetGrid(data, col='Outcome', hue='Outcome', height=4)
fig.map(sns.histplot, 'Insulin', bins=30, kde=False)
plt.show()

fig = sns.FacetGrid(data, col='Outcome', hue='Outcome', height=4)
fig.map(sns.histplot, 'BMI', bins=30, kde=False)
plt.show()

fig = sns.FacetGrid(data, col='Outcome', hue='Outcome', height=4)
fig.map(sns.histplot, 'DiabetesPedigreeFunction', bins=30, kde=False)
plt.show()

fig = sns.FacetGrid(data, col='Outcome', hue='Outcome', height=4)
fig.map(sns.histplot, 'Age', bins=30, kde=False)
plt.show()


Other datasets for classification:
If you need implementation for any of the topics mentioned above or assignment help on any of its variants, feel free to contact us


Comments