
20 Powerful AI Reporting and Analytics Solutions Enterprises Are Building in 2026
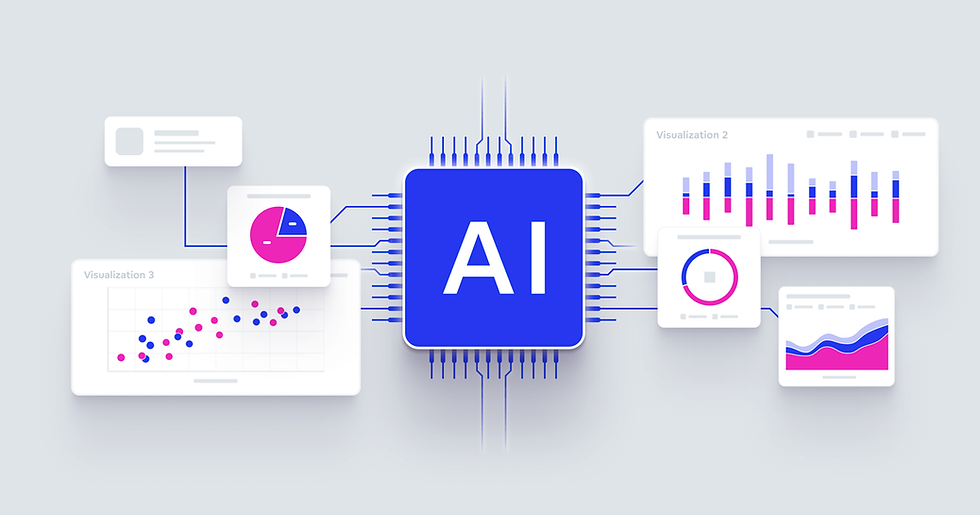
Download the full collection of 20 enterprise AI analytics use cases, architectures, and tech stacks (free document) at the end of this article.
Modern enterprises generate more data than ever before — from customer interactions and financial transactions to IoT sensors, operational logs, marketing campaigns, and real-time business events. Yet despite this massive growth in data volume, many organizations still rely on traditional dashboards and static reporting systems that were designed for a very different era of business intelligence.
Conventional analytics platforms are no longer enough for today’s fast-moving, data-intensive environments.
Static dashboards can show historical metrics, but they often fail to answer deeper business questions in real time. Teams still spend countless hours manually preparing reports, cleaning datasets, reconciling inconsistencies, and extracting insights from disconnected systems. As organizations scale, these fragmented analytics workflows become increasingly difficult to maintain, leading to delayed decision-making, poor visibility, and operational inefficiencies.
At the same time, enterprise leaders are no longer looking for platforms that simply visualize data. They want intelligent systems capable of understanding context, predicting outcomes, automating workflows, and delivering actionable insights automatically.
This shift is driving the rapid adoption of AI-powered analytics and reporting platforms.
Unlike traditional BI systems, modern AI analytics platforms combine machine learning, large language models (LLMs), predictive analytics, autonomous agents, and real-time processing pipelines to create intelligent decision-support ecosystems. These systems are capable of moving beyond passive reporting into proactive and autonomous intelligence.
Instead of manually searching through dashboards, users can now interact with analytics systems using natural language queries such as:
“Why did revenue decline in the western region last quarter?”
“Predict inventory shortages for the next 30 days.”
“Summarize the top operational anomalies detected this week.”
“Generate a financial performance report for executive leadership.”
This evolution is transforming analytics from a static visualization layer into an AI-driven business operating system.
Modern AI analytics platforms increasingly support capabilities such as:
Automated insight generation
Predictive forecasting and trend analysis
Conversational querying using LLMs
Real-time anomaly detection
Self-healing data pipelines
Intelligent workflow orchestration
AI-powered report generation
Explainable AI dashboards
Multi-source enterprise data integration
As enterprises continue to adopt cloud-native infrastructure, event-driven architectures, and AI-first operational strategies, the demand for intelligent analytics systems is growing rapidly across industries including finance, healthcare, manufacturing, retail, logistics, SaaS, and cybersecurity.
Another major challenge organizations face today is data fragmentation. Business data often exists across CRMs, ERP systems, spreadsheets, APIs, databases, internal documents, cloud applications, and third-party services. Traditional analytics solutions struggle to unify these sources efficiently, especially when dealing with semi-structured or unstructured data.
AI-powered analytics platforms solve this by integrating technologies such as:
Retrieval-Augmented Generation (RAG)
Vector databases
AI agents
Real-time streaming systems
Automated ETL/ELT pipelines
Semantic search
Federated learning
Explainability frameworks
Together, these technologies enable businesses to build intelligent analytics ecosystems that are scalable, adaptive, and capable of continuously improving over time.
The business impact is significant.
Organizations implementing AI-driven analytics platforms can achieve:
Faster and more informed decision-making
Reduced manual reporting workloads
Improved forecasting accuracy
Automated operational intelligence
Proactive anomaly detection
Enhanced data governance
Smarter resource allocation
Real-time business visibility
Increased operational efficiency
In many cases, AI analytics systems are evolving into autonomous decision-support layers that can monitor business operations, identify risks, recommend actions, and even trigger automated workflows without constant human intervention.
In this blog, we will explore some of the most powerful real-world use cases of AI analytics and reporting platforms — from custom RAG engines and predictive dashboards to self-healing pipelines, explainable AI systems, federated learning architectures, and intelligent data automation workflows.
Whether you're building an enterprise analytics SaaS platform, modernizing internal reporting infrastructure, or exploring AI-driven business intelligence solutions, these use cases will provide practical insights into how modern organizations are leveraging AI to transform analytics and decision-making at scale.
What Is an AI Analytics & Reporting Platform?
An AI analytics and reporting platform is an intelligent data system that combines traditional business intelligence capabilities with artificial intelligence, machine learning, large language models (LLMs), automation workflows, and real-time data processing to deliver actionable business insights at scale.
Unlike conventional reporting systems that primarily focus on dashboards and historical metrics, AI-powered analytics platforms are designed to understand, analyze, predict, explain, and automate business intelligence workflows.
These platforms do not simply display data — they actively interpret it. A modern AI analytics platform can:
Analyze structured and unstructured enterprise data
Detect anomalies automatically
Generate predictive forecasts
Answer natural language business queries
Produce AI-generated reports
Recommend operational actions
Monitor data quality issues
Automate analytics workflows
Trigger intelligent business processes in real time
In many enterprise environments, AI analytics platforms are becoming the operational intelligence layer that sits between raw business data and strategic decision-making.
Evolution of Analytics Platforms
The analytics landscape has evolved significantly over the last decade.
Traditional BI Platforms
Traditional business intelligence systems were primarily designed for:
Historical reporting
KPI dashboards
Static visualizations
SQL-based querying
Manual report generation
These systems typically relied heavily on analysts and data teams to prepare dashboards, write queries, clean datasets, and generate business reports.
While useful for descriptive analytics, traditional BI platforms often struggle with:
Real-time intelligence
Unstructured data analysis
Predictive modeling
Automated insights
Conversational querying
Dynamic workflow automation
Large-scale AI integration
As enterprise data complexity increased, these limitations became more visible.
AI-Powered Analytics Systems
AI-powered analytics platforms extend traditional BI by integrating machine learning models, automation engines, and LLM-based intelligence layers.
These systems can:
Forecast trends and business outcomes
Detect anomalies automatically
Generate natural language summaries
Perform semantic search across enterprise datasets
Analyze customer behavior patterns
Automate repetitive reporting workflows
Process text, images, audio, and semi-structured data
Instead of relying entirely on human analysts, AI systems assist users by proactively surfacing insights and recommendations.
For example, rather than manually identifying revenue fluctuations, an AI analytics system may automatically notify teams that:
“Revenue declined 12% in the western region due to reduced enterprise subscriptions from the healthcare sector.”
This shift moves analytics from passive visualization toward intelligent interpretation.
Autonomous Analytics Ecosystems
The next stage in analytics evolution is the rise of autonomous analytics ecosystems.
These platforms go beyond AI-assisted reporting and introduce intelligent agentic systems capable of:
Monitoring pipelines continuously
Repairing failed workflows
Selecting optimal prediction models
Retraining models automatically
Generating reports without human input
Detecting schema drift
Triggering operational automations
Coordinating multi-agent analytics tasks
In autonomous systems, AI agents can function as self-operating analytics assistants that continuously optimize enterprise intelligence workflows.
This creates a transition from:
Traditional Analytics | AI Analytics | Autonomous Analytics |
Static dashboards | Predictive insights | Self-operating intelligence |
Manual reporting | AI-assisted reporting | Autonomous reporting |
Human-driven workflows | AI-enhanced workflows | Agent-driven workflows |
Historical analysis | Real-time predictions | Adaptive decision systems |
SQL dashboards | Natural language querying | Intelligent orchestration |
Core Architecture of an AI Analytics Platform
A modern AI analytics platform typically consists of multiple interconnected layers that work together to process, analyze, and operationalize enterprise data.
1. Data Ingestion Layer
The ingestion layer is responsible for collecting data from multiple enterprise sources such as:
Databases
APIs
SaaS platforms
CRM systems
ERP systems
IoT devices
Cloud storage systems
Spreadsheets
Streaming event systems
This layer often supports both batch and real-time ingestion.
Modern ingestion systems are designed to handle:
Structured data
Semi-structured data
Unstructured documents
Images
Audio streams
Log files
Event data
Popular technologies include Kafka, Airbyte, Fivetran, and custom FastAPI-based ingestion services.
2. ETL/ELT Pipelines
ETL (Extract, Transform, Load) and ELT (Extract, Load, Transform) pipelines prepare raw enterprise data for downstream analytics workflows.
These pipelines perform tasks such as:
Data cleaning
Schema normalization
Deduplication
Validation
Aggregation
Feature engineering
Data enrichment
AI-powered platforms increasingly incorporate intelligent ETL pipelines capable of:
Detecting schema drift
Repairing failed transformations
Mapping columns semantically using LLMs
Automating transformation logic
Workflow orchestration tools like Apache Airflow are commonly used to manage these pipelines.
3. Vector Databases
Vector databases are a critical component in modern AI analytics systems, especially for Retrieval-Augmented Generation (RAG) and semantic search applications.
Instead of storing only relational records, vector databases store embeddings generated by machine learning models.
These embeddings enable systems to:
Search enterprise knowledge semantically
Retrieve relevant documents intelligently
Query internal datasets conversationally
Analyze unstructured business content
Common vector databases include:
Pinecone
ChromaDB
Weaviate
FAISS
Milvus
4. LLM Orchestration Layer
Large language models are becoming central to enterprise analytics workflows.
The orchestration layer manages how LLMs interact with:
Data sources
Retrieval pipelines
APIs
AI agents
External tools
Memory systems
This layer enables features such as:
Natural language querying
AI-generated reports
Conversational analytics
Automated business summaries
Intelligent recommendations
Frameworks like LangChain and LlamaIndex are commonly used to orchestrate enterprise LLM workflows.
5. AI Agents
AI agents introduce autonomous decision-making into analytics systems. These agents can:
Monitor pipelines
Trigger workflows
Validate outputs
Coordinate tools
Detect anomalies
Repair failures
Generate reports
Route tasks dynamically
In advanced systems, multiple agents collaborate together to execute complex analytics operations autonomously.
Examples include:
Financial reporting agents
Data quality monitoring agents
Forecasting agents
Data extraction agents
Competitor intelligence agents
6. Visualization Engines
Visualization layers transform processed data into dashboards, charts, reports, and interactive interfaces.
Modern AI dashboards increasingly support:
Real-time streaming visualizations
AI-generated summaries
Interactive filtering
Conversational interfaces
Predictive visual analytics
Geospatial mapping
Explainability overlays
Visualization frameworks may include:
Plotly
Streamlit
Grafana
Apache Superset
Tableau integrations
Custom React dashboards
7. Prediction Models
Machine learning models power predictive analytics capabilities.
These models are used for:
Sales forecasting
Customer churn prediction
Fraud detection
Predictive maintenance
Risk scoring
Demand forecasting
Healthcare predictions
Operational intelligence
Platforms often combine classical ML with deep learning systems depending on the use case.
Common frameworks include:
Scikit-learn
XGBoost
TensorFlow
PyTorch
8. Explainability Layer
Enterprise AI systems increasingly require explainability and transparency.
An explainability layer helps organizations understand:
Why a model made a prediction
Which features influenced outcomes
Whether bias exists
How confidence scores are calculated
Explainable AI is especially important in industries such as:
Finance
Healthcare
Insurance
Government
Legal technology
Tools like SHAP and Fairlearn are commonly integrated into analytics platforms for transparency and fairness monitoring.
9. API Gateways and Integration Layer
Modern analytics systems rarely operate in isolation.
API gateways allow AI analytics platforms to integrate with:
CRM systems
ERP platforms
Cloud applications
Marketing tools
Business automation systems
Third-party APIs
Internal microservices
This integration layer enables intelligent workflows across enterprise ecosystems.
GraphQL and FastAPI are increasingly popular for building high-performance analytics APIs.
Common Technology Stack for AI Analytics Platforms
Building a scalable AI analytics ecosystem requires a combination of AI, backend, data engineering, and infrastructure technologies.
Below is a common technology stack used in modern AI analytics platforms.
Category | Technologies |
Programming Language | Python |
Backend APIs | FastAPI |
LLM Orchestration | LangChain, LlamaIndex |
Databases | PostgreSQL, MongoDB |
Streaming Systems | Kafka, Redis Streams |
Caching Layer | Redis |
Vector Databases | Pinecone, ChromaDB, Weaviate |
Machine Learning | Scikit-learn, XGBoost |
Deep Learning | PyTorch, TensorFlow |
Explainable AI | SHAP, Fairlearn |
Computer Vision | Vision Transformers (ViTs) |
Workflow Orchestration | Apache Airflow |
Containerization | Docker |
Infrastructure Orchestration | Kubernetes |
Monitoring | Prometheus, Grafana |
Cloud Platforms | AWS, Azure, GCP |
As enterprise analytics platforms continue evolving, the integration of AI agents, LLM orchestration frameworks, vector search systems, and autonomous workflows is reshaping how organizations interact with business intelligence.
The result is a new generation of analytics systems capable of delivering intelligent, scalable, real-time, and increasingly autonomous decision support across the enterprise.
Why Enterprises Are Investing in AI Analytics Platforms
Enterprises today operate in highly data-driven environments where traditional reporting systems are no longer sufficient. Static dashboards and manually generated reports often fail to provide the speed, intelligence, and adaptability modern businesses require. As organizations generate massive volumes of structured and unstructured data, the need for AI-powered analytics platforms is rapidly increasing.
Modern AI analytics systems combine machine learning, large language models (LLMs), predictive analytics, automation, and real-time data processing to help businesses make faster and smarter decisions. These platforms go beyond traditional business intelligence by delivering automated insights, conversational analytics, predictive forecasting, and intelligent workflow automation.
One of the biggest reasons enterprises are adopting AI analytics platforms is the demand for real-time intelligence. Businesses can no longer wait for end-of-day or weekly reports to identify operational issues or market changes. AI-powered systems continuously analyze live data streams, detect anomalies, monitor KPIs, and surface actionable insights instantly.
Organizations are also investing in AI analytics to reduce operational costs and improve efficiency. Traditional reporting workflows often involve manual data cleaning, dashboard preparation, report generation, and repetitive analysis tasks. AI-driven platforms automate many of these processes through intelligent ETL pipelines, AI agents, and automated reporting systems, significantly reducing manual effort and operational overhead.
Another major advantage is the ability to accelerate reporting cycles. AI analytics platforms can automatically generate summaries, dashboards, forecasts, and executive reports in real time, allowing organizations to make quicker business decisions. Instead of spending hours compiling reports, teams can focus on strategy and execution. Predictive analytics is another key driver behind enterprise adoption. Modern AI systems can forecast sales trends, customer churn, operational risks, equipment failures, and market demand using historical and real-time data. This enables businesses to shift from reactive decision-making to proactive business strategy.
Enterprises are also prioritizing governance, explainability, and compliance. AI analytics platforms increasingly include features such as audit trails, role-based access controls, explainable AI dashboards, and bias detection systems to meet regulatory and security requirements across industries like finance, healthcare, and insurance.
In addition, AI-powered platforms allow organizations to deliver more personalized reporting experiences. Different teams and stakeholders can receive customized dashboards, automated summaries, and natural language insights based on their specific business needs.
Large language models are further transforming analytics by enabling conversational querying and AI-assisted decision-making. Users can interact with analytics systems using natural language instead of relying solely on dashboards or SQL queries. This makes business intelligence more accessible across organizations.
The market trends clearly reflect this shift. The global AI analytics market continues to grow rapidly as enterprises invest in intelligent automation, predictive systems, and AI-driven business intelligence platforms. Organizations across industries are increasingly adopting LLM-based analytics solutions, autonomous reporting workflows, and AI agents to modernize their analytics infrastructure and gain a competitive advantage through data-driven intelligence.
Core Architecture of an AI Analytics Platform
Modern AI analytics platforms are built using multiple interconnected layers that work together to collect, process, analyze, and operationalize enterprise data in real time. Unlike traditional BI systems, these architectures are designed to support AI-driven automation, predictive analytics, conversational querying, and autonomous workflows at scale.
A typical AI analytics platform architecture includes the following core components:
1. Data Sources
The foundation of any analytics platform is the data layer. Modern enterprises generate data from a wide variety of sources, including:
CRM and ERP systems
Databases
SaaS applications
APIs
IoT devices
Financial systems
Cloud storage platforms
Web applications
Operational logs
Documents, PDFs, and spreadsheets
AI analytics platforms are designed to handle both structured and unstructured enterprise data across multiple environments.
2. Data Pipelines
Data pipelines are responsible for ingesting, transforming, validating, and preparing data for downstream analytics workflows.
These pipelines typically support:
Batch processing
Real-time streaming
Data cleaning
Schema normalization
Feature engineering
Data enrichment
Modern platforms increasingly use event-driven systems such as Kafka and real-time streaming architectures to process live business data continuously. Intelligent ETL/ELT pipelines powered by AI can also detect failures, repair broken workflows, and manage schema drift automatically.
3. Data Lake / Data Warehouse
Once processed, enterprise data is stored in centralized repositories such as data lakes or data warehouses.
These storage layers enable:
Historical analytics
Business reporting
Model training
Real-time querying
Cross-functional data access
Data warehouses are commonly optimized for structured analytics, while data lakes support large-scale storage for structured, semi-structured, and unstructured data.
Many enterprise platforms also implement multi-tenant architecture to securely isolate customer or organizational data while supporting scalable SaaS deployments.
4. AI Layer
The AI layer is the intelligence engine of the platform.
This layer integrates:
Machine learning models
Predictive analytics systems
Large language models (LLMs)
Computer vision systems
Recommendation engines
Forecasting algorithms
AI models analyze enterprise data to generate predictions, identify anomalies, detect patterns, and automate decision-making workflows.
Modern platforms also incorporate Retrieval-Augmented Generation (RAG) pipelines that combine vector search with LLMs to enable conversational querying across private enterprise datasets.
For example, users can ask:
“Summarize revenue trends for the last quarter.”
“Identify anomalies in operational expenses.”
“Explain why customer churn increased this month.”
The system retrieves relevant enterprise data semantically and uses LLMs to generate contextual insights.
5. Agentic Orchestration Layer
Advanced AI analytics platforms increasingly use AI agents to automate complex workflows.
This orchestration layer coordinates:
Data pipelines
AI models
APIs
Monitoring systems
Reporting workflows
External tools
AI agents can autonomously:
Generate reports
Monitor system health
Detect anomalies
Trigger alerts
Repair pipelines
Schedule workflows
Coordinate multi-step analytics tasks
These agentic systems transform analytics platforms from passive reporting tools into intelligent operational systems capable of autonomous decision support.
6. Visualization Layer
The visualization layer presents insights through dashboards, charts, reports, and interactive interfaces.
Modern AI-powered dashboards often support:
Real-time analytics
Predictive visualizations
AI-generated summaries
Conversational interfaces
Geospatial heatmaps
Explainability dashboards
Instead of only displaying historical KPIs, visualization layers now surface intelligent recommendations, anomaly alerts, and predictive business insights.
7. APIs and Integrations
Enterprise analytics systems must integrate with a wide range of internal and external platforms.
API gateways and integration layers allow analytics platforms to connect with:
CRM systems
ERP software
Marketing tools
Cloud services
Business automation platforms
Third-party APIs
Internal microservices
Technologies such as FastAPI and GraphQL are commonly used to build scalable, high-performance APIs for analytics platforms.
These integrations enable seamless data movement and operational automation across enterprise ecosystems.
8. Governance and Security Layer
As AI adoption increases, governance, privacy, and security become critical architectural requirements.
Modern AI analytics platforms include governance layers for:
Role-based access control
Data encryption
Audit logging
Compliance monitoring
Explainable AI
Bias detection
Tenant isolation
Data lineage tracking
Some enterprise systems also implement federated learning architectures, allowing AI models to train across decentralized datasets without exposing sensitive raw data. This is especially important in industries such as healthcare, finance, and government.
Modern Architectural Capabilities in AI Analytics Platforms
Today’s AI analytics ecosystems are increasingly built around several advanced architectural concepts:
RAG Pipelines | Enable semantic querying and conversational analytics using vector search and LLMs. |
Event-Driven Systems | Support real-time data processing, anomaly detection, and automated workflow execution. |
Multi-Tenant Architecture | Allows SaaS analytics platforms to securely serve multiple organizations within shared infrastructure. |
Real-Time Streaming | Processes live business events continuously for instant intelligence and operational monitoring. |
Federated Learning | Improves privacy and compliance by training models across distributed datasets without centralizing sensitive data. |
Vector Search | Enables semantic retrieval of enterprise documents, reports, logs, and knowledge bases using embeddings and vector databases. |
Together, these architectural layers create intelligent analytics ecosystems capable of delivering scalable, real-time, AI-powered business intelligence across modern enterprises.
20 Advanced Use Cases of an AI Analytics & Reporting Platform
Use Case 1: Developing a Custom RAG Engine for Querying Private Datasets
Overview
A custom Retrieval-Augmented Generation (RAG) engine enables enterprises to query private business data using natural language. Instead of manually searching through reports, PDFs, spreadsheets, databases, or internal documentation, users can ask questions conversationally and receive contextual AI-generated answers grounded in enterprise data.
This type of system is becoming increasingly important for organizations dealing with large volumes of fragmented internal information spread across multiple platforms and departments.
Business Problem
Many enterprises struggle with:
Disconnected internal knowledge systems
Slow manual report analysis
Limited search capabilities across documents
Difficulty extracting insights from unstructured data
Dependency on analysts for information retrieval
Security concerns around exposing private business data to public AI systems
Traditional dashboards and keyword-based search systems often fail to provide contextual business insights efficiently.
Key Features
Conversational querying using natural language
Semantic search across enterprise documents
AI-generated summaries and insights
Internal knowledge retrieval
Context-aware analytics responses
Multi-document reasoning
Secure querying of private datasets
Role-based access controls
System Architecture
The system typically follows a RAG-based architecture:
Enterprise documents and datasets are ingested into the platform
Embedding models convert content into vector representations
Embeddings are stored inside a vector database
User queries are converted into embeddings
Relevant context is retrieved semantically using vector search
An LLM generates contextual responses using retrieved enterprise data
The platform may also integrate APIs, dashboards, authentication systems, and AI agents for workflow automation.
AI/ML Components Used
Embedding models
Vector search
Retrieval-Augmented Generation (RAG)
Large Language Models (LLMs)
Semantic similarity search
AI orchestration pipelines
Conversational AI
Recommended Tech Stack
Layer | Technologies |
Backend API | FastAPI |
AI Orchestration | LangChain, LlamaIndex |
LLMs | OpenAI, Mistral |
Vector Database | Pinecone, ChromaDB, Weaviate |
Database | PostgreSQL |
Document Processing | PyPDF, Unstructured |
Deployment | Docker, Kubernetes |
Authentication | JWT, OAuth2 |
Development Complexity
Complexity Level: Advanced
Building an enterprise-grade RAG system requires expertise in:
LLM orchestration
Retrieval optimization
Vector databases
Data security
Prompt engineering
Scalable backend architecture
Production systems also require monitoring, caching, hallucination reduction, and access control mechanisms.
Estimated Build Time
Scope | Estimated Timeline |
MVP Prototype | 2–4 weeks |
Production-Ready Platform | 2–3 months |
Enterprise-Scale Deployment | 4–6 months |
Timelines vary depending on dataset complexity, integrations, security requirements, and scalability needs.
Business Benefits
Operational Benefits
Faster knowledge retrieval
Reduced manual analysis effort
Improved internal collaboration
Faster report generation
Financial Benefits
Lower analyst workload
Reduced operational inefficiencies
Faster access to business insights
Strategic Benefits
Improved decision-making
Better utilization of enterprise knowledge
Enhanced data accessibility across teams
Organizations can significantly reduce the time spent searching for information across disconnected systems.
Industry Applications
Finance
Internal financial reporting search
Risk and compliance analytics
Healthcare
Clinical knowledge retrieval
Patient document analysis
SaaS
Support ticket intelligence
Product analytics querying
Manufacturing
Operational documentation analysis
Maintenance knowledge systems
Legal & Enterprise Operations
Contract analysis
Internal policy search
Compliance document querying
Use Case 2: Automating Financial Report Generation with LLM Agents
Overview
Automating financial report generation using LLM agents enables enterprises to generate accurate, real-time financial summaries, KPI reports, forecasting documents, and executive insights with minimal manual intervention. Instead of relying on analysts to compile spreadsheets and create reports manually, AI agents can analyze financial data, generate summaries, and produce structured reports automatically.
This significantly improves reporting efficiency while reducing operational workload for finance teams.
Business Problem
Traditional financial reporting processes are often:
Time-consuming
Highly manual
Error-prone
Dependent on spreadsheets
Delayed due to data consolidation workflows
Finance teams frequently spend hours collecting data from multiple systems, validating KPIs, preparing summaries, and generating executive reports.
As organizations scale, maintaining reporting accuracy and speed becomes increasingly difficult.
Key Features
Automated financial report generation
AI-generated executive summaries
KPI tracking and analysis
Real-time revenue and expense reporting
Predictive financial forecasting
Natural language report generation
Automated anomaly detection
Multi-source financial data integration
System Architecture
The system typically integrates:
Financial data sources such as ERP systems, databases, and accounting software
ETL pipelines for data cleaning and transformation
LLM agents for summarization and report generation
Analytics engines for KPI calculations and forecasting
Dashboard and export layers for PDFs, Excel reports, and executive presentations
AI agents can autonomously fetch financial data, validate calculations, generate insights, and distribute reports to stakeholders.
AI/ML Components Used
Large Language Models (LLMs)
AI agents
Predictive forecasting models
Time-series analytics
Natural language generation (NLG)
Anomaly detection systems
Recommended Tech Stack
Layer | Technologies |
Backend API | FastAPI |
AI Framework | LangChain |
LLMs | OpenAI, Mistral |
Database | PostgreSQL |
Workflow Automation | Apache Airflow |
Data Processing | Pandas, NumPy |
Reporting | ReportLab, OpenPyXL |
Deployment | Docker, Kubernetes |
Development Complexity
Complexity Level: Intermediate to Advanced
The complexity depends on:
Number of financial integrations
Reporting requirements
Compliance needs
Forecasting sophistication
Multi-department data aggregation
Enterprise deployments also require strong validation and governance layers to ensure reporting accuracy.
Estimated Build Time
Scope | Estimated Timeline |
MVP Reporting System | 2–3 weeks |
Production-Ready Platform | 2–4 months |
Enterprise Financial Intelligence System | 4–6 months |
Business Benefits
Operational Benefits
Reduced manual reporting workload
Faster report generation cycles
Improved reporting consistency
Automated financial summaries
Financial Benefits
Reduced operational costs
Lower dependency on repetitive analyst tasks
Improved forecasting accuracy
Strategic Benefits
Faster executive decision-making
Real-time financial visibility
Better risk monitoring
Improved financial planning
Organizations can reduce financial reporting time from days to minutes using AI-driven automation.
Industry Applications
Finance & Banking
Revenue reporting
Risk analysis
Investment summaries
SaaS Businesses
Subscription analytics
ARR/MRR reporting
Churn forecasting
Retail & E-Commerce
Sales performance reports
Profitability analysis
Inventory cost tracking
Enterprise Operations
Budget forecasting
Operational expense analysis
Department-level KPI reporting
Use Case 3: Building a Real-Time Predictive Sales Dashboard
Overview
A real-time predictive sales dashboard helps enterprises monitor live sales performance while forecasting future revenue trends using AI and machine learning. Unlike traditional dashboards that only display historical metrics, predictive sales platforms combine streaming analytics, forecasting models, and intelligent reporting to provide proactive business insights.
These systems enable organizations to make faster sales decisions, optimize inventory planning, and identify revenue opportunities in real time.
Business Problem
Many organizations struggle with:
Delayed sales reporting
Inaccurate revenue forecasting
Lack of real-time visibility
Fragmented sales data across systems
Manual KPI tracking
Difficulty identifying sales trends early
Traditional reporting systems often fail to provide predictive insights needed for dynamic business environments.
Key Features
Real-time sales monitoring
Revenue forecasting
Predictive trend analysis
Regional and product-wise analytics
KPI tracking dashboards
Automated anomaly alerts
AI-generated sales insights
Interactive visual analytics
System Architecture
The architecture typically includes:
Real-time data ingestion from CRM systems, APIs, and transaction platforms
Streaming pipelines for continuous data processing
Predictive ML models for sales forecasting
AI analytics engines for trend detection and anomaly analysis
Dashboard and visualization layers for business reporting
The platform continuously processes incoming sales data and updates forecasts dynamically.
AI/ML Components Used
Time-series forecasting models
Predictive analytics
Anomaly detection
Real-time streaming analytics
Recommendation systems
AI-generated summaries
Recommended Tech Stack
Layer | Technologies |
Backend API | FastAPI |
Streaming System | Kafka, Redis Streams |
Machine Learning | Scikit-learn, XGBoost |
Database | PostgreSQL |
Visualization | Plotly, Streamlit, React |
Caching | Redis |
Deployment | Docker, Kubernetes |
Monitoring | Grafana, Prometheus |
Development Complexity
Complexity Level: Intermediate to Advanced
Complexity depends on:
Number of data integrations
Real-time streaming requirements
Forecasting accuracy expectations
Dashboard customization
Scalability needs
Enterprise-scale deployments also require low-latency data pipelines and robust monitoring systems.
Estimated Build Time
Scope | Estimated Timeline |
MVP Dashboard | 2–4 weeks |
Production-Ready Platform | 2–3 months |
Enterprise-Scale Analytics System | 4–6 months |
Business Benefits
Operational Benefits
Real-time sales visibility
Faster reporting cycles
Automated KPI tracking
Improved sales monitoring
Financial Benefits
Better revenue forecasting
Improved inventory planning
Reduced operational inefficiencies
Early identification of sales declines
Strategic Benefits
Faster business decision-making
Improved demand prediction
Better market responsiveness
Enhanced sales strategy optimization
Organizations can significantly improve forecasting accuracy and reduce delays in sales intelligence reporting.
Industry Applications
Retail & E-Commerce
Product demand forecasting
Regional sales analytics
Inventory optimization
SaaS Businesses
ARR/MRR forecasting
Subscription trend analysis
Customer expansion prediction
Manufacturing
Distribution analytics
Sales pipeline forecasting
Dealer performance monitoring
Enterprise Sales Teams
Pipeline intelligence
Territory performance analysis
Revenue trend prediction
Use Case 4: Automated Exploratory Data Analysis (EDA) Pipelines
Overview
Automated Exploratory Data Analysis (EDA) pipelines help organizations rapidly analyze datasets using AI-driven profiling, statistical analysis, and visualization systems. Instead of manually inspecting datasets, generating charts, and identifying anomalies, enterprises can automate the entire EDA workflow to accelerate analytics and model development.
These systems are especially valuable for large-scale analytics platforms handling continuously evolving enterprise data.
Business Problem
Organizations often face challenges such as:
Time-consuming manual data analysis
Poor data visibility
Inconsistent dataset quality
Difficulty identifying anomalies and trends
Slow analytics workflows
Delays in machine learning experimentation
Manual EDA processes become increasingly inefficient as enterprise datasets grow in volume and complexity.
Key Features
Automated data profiling
Missing value analysis
Correlation analysis
Statistical summaries
Outlier detection
Automated chart generation
Dataset quality monitoring
AI-generated analytical insights
System Architecture
The system typically includes:
Data ingestion from databases, APIs, spreadsheets, or cloud storage
Automated preprocessing and validation pipelines
Statistical analysis and visualization engines
AI-driven anomaly and pattern detection
Report generation and dashboard interfaces
AI systems can automatically analyze datasets and generate insights without requiring manual analyst intervention.
AI/ML Components Used
Statistical analysis models
Data profiling systems
Anomaly detection algorithms
Correlation analysis
AI-generated summarization
Visualization recommendation systems
Recommended Tech Stack
Layer | Technologies |
Backend API | FastAPI |
Data Processing | Pandas, NumPy |
Machine Learning | Scikit-learn |
Visualization | Plotly, Matplotlib, Seaborn |
Workflow Automation | Apache Airflow |
Reporting | Streamlit, Jupyter |
Database | PostgreSQL |
Deployment | Docker, Kubernetes |
Development Complexity
Complexity Level: Intermediate
The complexity depends on:
Dataset diversity
Real-time processing requirements
Visualization complexity
AI-generated insight capabilities
Enterprise integration needs
Advanced implementations may also include automated feature engineering and ML readiness analysis.
Estimated Build Time
Scope | Estimated Timeline |
MVP EDA Pipeline | 1–3 weeks |
Production-Ready Platform | 1–2 months |
Enterprise Analytics System | 3–4 months |
Business Benefits
Operational Benefits
Faster dataset analysis
Reduced analyst workload
Improved data visibility
Automated quality monitoring
Financial Benefits
Reduced manual analysis costs
Faster analytics delivery
Improved ML development efficiency
Strategic Benefits
Better decision-making
Faster experimentation cycles
Improved data governance
Accelerated AI adoption
Organizations can reduce exploratory analysis time from hours or days to minutes using automated EDA systems.
Industry Applications
Finance
Fraud analysis
Risk data profiling
Transaction pattern analysis
Healthcare
Clinical dataset analysis
Patient trend visualization
Medical research workflows
Retail & E-Commerce
Customer behavior analysis
Product performance analytics
Sales trend analysis
SaaS & Enterprise Analytics
User activity analysis
Operational data profiling
Product usage analytics
Use Case 5: Predictive Healthcare Analytics Dashboards
Overview
Predictive healthcare analytics dashboards help healthcare organizations analyze patient data, forecast medical risks, monitor operational performance, and improve clinical decision-making using AI and machine learning. These systems combine real-time analytics, predictive modeling, and intelligent reporting to provide actionable healthcare insights.
Modern healthcare analytics platforms are increasingly used for patient risk prediction, disease forecasting, treatment optimization, and hospital resource management.
Business Problem
Healthcare organizations often struggle with:
Delayed patient risk identification
Fragmented medical data systems
High operational workload
Limited predictive capabilities
Inefficient hospital resource allocation
Manual reporting processes
Traditional reporting systems typically focus on historical data and lack real-time predictive intelligence required for modern healthcare operations.
Key Features
Patient risk prediction
Disease trend forecasting
Real-time healthcare dashboards
Clinical KPI monitoring
Hospital resource analytics
Predictive patient outcome analysis
Automated reporting
AI-assisted decision support
System Architecture
The platform typically includes:
Integration with EHR/EMR systems, hospital databases, and healthcare APIs
Data processing and patient record normalization pipelines
Machine learning models for predictive healthcare analytics
Real-time monitoring and visualization dashboards
AI-powered reporting and alerting systems
The system continuously analyzes healthcare data to identify risks, forecast outcomes, and support medical decision-making.
AI/ML Components Used
Predictive analytics models
Classification algorithms
Time-series forecasting
Risk scoring systems
Anomaly detection
AI-generated summarization
Recommended Tech Stack
Layer | Technologies |
Backend API | FastAPI |
Machine Learning | Scikit-learn, XGBoost |
Database | PostgreSQL |
Data Processing | Pandas, NumPy |
Visualization | Plotly, Streamlit |
Workflow Automation | Apache Airflow |
Deployment | Docker, Kubernetes |
Monitoring | Grafana |
Development Complexity
Complexity Level: Advanced
Healthcare systems require:
Secure data handling
Regulatory compliance
Real-time analytics
High model accuracy
Integration with clinical systems
Enterprise deployments also require strong governance, explainability, and privacy controls.
Estimated Build Time
Scope | Estimated Timeline |
MVP Dashboard | 3–5 weeks |
Production-Ready Platform | 3–5 months |
Enterprise Healthcare Analytics System | 6+ months |
Business Benefits
Operational Benefits
Faster patient risk identification
Improved hospital monitoring
Automated reporting workflows
Better resource utilization
Financial Benefits
Reduced operational inefficiencies
Lower healthcare management costs
Improved forecasting accuracy
Strategic Benefits
Better clinical decision-making
Improved patient outcomes
Enhanced healthcare planning
Real-time operational intelligence
Predictive healthcare systems can help organizations identify high-risk patients earlier and improve treatment planning efficiency.
Industry Applications
Hospitals & Healthcare Networks
Patient monitoring dashboards
ICU analytics
Bed occupancy forecasting
HealthTech Platforms
Predictive care systems
Remote patient monitoring
AI-assisted diagnostics
Insurance & Healthcare Analytics
Risk scoring
Claims prediction
Fraud detection
Public Health Systems
Disease trend forecasting
Population health analytics
Healthcare resource planning
Use Case 6: Federated Learning for Privacy-Preserving Analytics
Overview
Federated learning enables organizations to train AI models across distributed datasets without transferring sensitive raw data to a centralized system. This approach is becoming increasingly important for enterprises operating in privacy-sensitive industries such as healthcare, finance, insurance, and government.
By combining decentralized machine learning with secure analytics infrastructure, organizations can build AI-powered analytics systems while maintaining strong data privacy and regulatory compliance.
Business Problem
Many enterprises face challenges such as:
Strict data privacy regulations
Restrictions on centralized data storage
Sensitive customer or patient information
Cross-organization collaboration limitations
Security risks associated with data sharing
Compliance requirements like GDPR and HIPAA
Traditional AI systems often require centralized datasets, creating privacy, governance, and security concerns.
Key Features
Distributed model training
Privacy-preserving analytics
Secure collaborative AI
Decentralized data processing
Federated model aggregation
Local data retention
Cross-organization analytics
Compliance-friendly AI architecture
System Architecture
A federated learning system typically includes:
Local enterprise datasets stored securely within individual organizations
Local machine learning training environments
Federated aggregation servers for combining model updates
Secure communication pipelines
Centralized analytics dashboards for monitoring performance
Instead of transferring raw data, organizations only share model parameters or gradients, significantly improving privacy and security.
AI/ML Components Used
Federated learning frameworks
Distributed machine learning
Secure aggregation algorithms
Differential privacy
Predictive analytics models
Model synchronization systems
Recommended Tech Stack
Layer | Technologies |
Backend API | FastAPI |
Federated Learning | TensorFlow Federated, Flower |
Machine Learning | PyTorch, Scikit-learn |
Database | PostgreSQL |
Messaging/Streaming | Kafka |
Security | TLS, OAuth2 |
Deployment | Docker, Kubernetes |
Monitoring | Prometheus, Grafana |
Development Complexity
Complexity Level: Advanced to Enterprise-Grade
Federated learning systems require expertise in:
Distributed AI systems
Privacy-preserving machine learning
Secure communication protocols
Multi-node orchestration
Compliance and governance
Production deployments also involve synchronization, model consistency, and security challenges.
Estimated Build Time
Scope | Estimated Timeline |
MVP Federated Prototype | 1–2 months |
Production-Ready System | 4–6 months |
Enterprise Multi-Organization Platform | 6–12 months |
Business Benefits
Operational Benefits
Secure distributed analytics
Reduced centralized data dependency
Improved cross-organization collaboration
Better data governance
Financial Benefits
Lower compliance risks
Reduced data transfer costs
Improved AI scalability
Strategic Benefits
Privacy-preserving AI adoption
Regulatory compliance support
Enhanced customer trust
Scalable enterprise AI collaboration
Federated learning allows organizations to leverage AI analytics while minimizing privacy and security risks.
Industry Applications
Healthcare
Collaborative medical research
Multi-hospital patient analytics
Privacy-preserving diagnostics
Finance & Banking
Fraud detection
Risk modeling
Cross-bank analytics collaboration
Insurance
Distributed claims analytics
Customer risk prediction
Secure underwriting models
Government & Public Sector
Privacy-sensitive citizen analytics
Secure intelligence systems
Cross-agency AI collaboration
Use Case 7: Event-Driven Data Cleaning Microservices
Overview
Event-driven data cleaning microservices help enterprises automatically detect, validate, and correct data quality issues in real time. Instead of relying on batch-based data cleaning workflows, organizations can build scalable microservices that continuously monitor incoming data streams and trigger automated cleaning processes whenever anomalies or inconsistencies are detected.
These systems are especially valuable for AI analytics platforms handling large-scale, real-time enterprise data pipelines.
Business Problem
Organizations frequently face challenges such as:
Duplicate records
Missing values
Invalid formats
Schema inconsistencies
Corrupted streaming data
Delayed data validation
Poor data quality affecting analytics accuracy
Traditional batch-based cleaning systems often fail to handle real-time enterprise data efficiently.
Key Features
Real-time data validation
Event-driven processing
Automated data normalization
Duplicate detection
Schema validation
Streaming anomaly detection
Microservice-based architecture
Intelligent error handling
System Architecture
The system typically includes:
Real-time data ingestion from APIs, applications, databases, or IoT systems
Event streaming infrastructure for processing incoming records
Independent microservices for validation, normalization, deduplication, and correction
Monitoring and alerting systems for pipeline failures
Cleaned data storage for downstream analytics workflows
Each microservice performs a specialized cleaning task and can scale independently based on workload.
AI/ML Components Used
Data validation models
Anomaly detection algorithms
Schema matching systems
AI-assisted normalization
Pattern recognition models
Automated error classification
Recommended Tech Stack
Layer | Technologies |
Backend API | FastAPI |
Event Streaming | Kafka, RabbitMQ |
Data Processing | Pandas, PySpark |
Machine Learning | Scikit-learn |
Database | PostgreSQL |
Caching | Redis |
Workflow Automation | Apache Airflow |
Deployment | Docker, Kubernetes |
Development Complexity
Complexity Level: Intermediate to Advanced
Complexity depends on:
Streaming scale
Data source diversity
Validation rules
Real-time latency requirements
Fault tolerance needs
Enterprise systems also require observability, retry mechanisms, and scalable orchestration.
Estimated Build Time
Scope | Estimated Timeline |
MVP Cleaning Pipeline | 2–4 weeks |
Production-Ready System | 2–3 months |
Enterprise-Scale Streaming Platform | 4–6 months |
Business Benefits
Operational Benefits
Improved data quality
Reduced manual cleaning effort
Faster analytics readiness
Real-time validation workflows
Financial Benefits
Reduced operational inefficiencies
Lower data correction costs
Improved reporting accuracy
Strategic Benefits
Better analytics reliability
Improved AI model performance
Scalable real-time infrastructure
Faster business intelligence workflows
High-quality data significantly improves downstream analytics, forecasting, and AI system accuracy.
Industry Applications
Finance
Transaction validation
Fraud-related data normalization
Real-time compliance checks
Healthcare
Patient data standardization
Clinical data validation
Healthcare record cleaning
Retail & E-Commerce
Product catalog normalization
Customer data cleaning
Inventory data validation
SaaS & Enterprise Platforms
Event stream processing
User activity validation
Operational analytics pipelines
Use Case 8: Advanced Anomaly Detection Systems
Overview
Advanced anomaly detection systems help enterprises identify unusual patterns, operational risks, fraud attempts, system failures, and abnormal business activities using AI and machine learning. These platforms continuously analyze real-time and historical data to detect deviations from normal behavior and trigger automated alerts or corrective workflows.
Modern anomaly detection systems are widely used across finance, cybersecurity, manufacturing, healthcare, and enterprise operations.
Business Problem
Organizations often struggle with:
Fraudulent transactions
Undetected operational failures
Cybersecurity threats
Unexpected system behavior
Revenue leakage
Manual monitoring limitations
Delayed incident detection
Traditional rule-based monitoring systems frequently fail to identify complex or evolving anomalies in large-scale enterprise environments.
Key Features
Real-time anomaly detection
AI-driven risk monitoring
Fraud detection systems
Operational failure prediction
Automated alert generation
Pattern deviation analysis
Streaming analytics
Intelligent incident monitoring
System Architecture
The architecture typically includes:
Real-time data ingestion from enterprise systems, APIs, logs, or IoT devices
Streaming pipelines for continuous event processing
Machine learning models for anomaly detection
Monitoring and alerting systems
Dashboards for anomaly visualization and investigation
The system continuously learns normal behavioral patterns and identifies abnormal deviations automatically.
AI/ML Components Used
Isolation Forest
Autoencoders
Clustering algorithms
Time-series anomaly detection
Statistical outlier detection
Real-time streaming analytics
Predictive monitoring systems
Recommended Tech Stack
Layer | Technologies |
Backend API | FastAPI |
Streaming System | Kafka, Redis Streams |
Machine Learning | Scikit-learn, PyTorch |
Data Processing | Pandas, NumPy |
Database | PostgreSQL |
Visualization | Grafana, Plotly |
Monitoring | Prometheus |
Deployment | Docker, Kubernetes |
Development Complexity
Complexity Level: Advanced
Complexity depends on:
Data volume and velocity
Real-time processing requirements
Detection accuracy expectations
Alerting workflows
Industry-specific compliance needs
Enterprise-scale systems also require continuous model monitoring and retraining pipelines.
Estimated Build Time
Scope | Estimated Timeline |
MVP Detection System | 3–5 weeks |
Production-Ready Platform | 3–5 months |
Enterprise Real-Time Monitoring System | 6+ months |
Business Benefits
Operational Benefits
Faster anomaly detection
Automated monitoring workflows
Reduced manual inspection effort
Improved operational visibility
Financial Benefits
Reduced fraud losses
Lower downtime costs
Improved operational efficiency
Strategic Benefits
Better risk management
Proactive incident response
Enhanced cybersecurity posture
Improved system reliability
Organizations can detect operational and financial anomalies significantly earlier using AI-driven monitoring systems.
Industry Applications
Finance & Banking
Fraud detection
Suspicious transaction monitoring
Risk analytics
Cybersecurity
Threat detection
Network anomaly monitoring
Intrusion detection systems
Manufacturing
Equipment anomaly detection
Predictive maintenance
Sensor analytics
SaaS & Enterprise Operations
Infrastructure monitoring
API anomaly detection
Operational intelligence systems
Conclusion
AI analytics platforms are rapidly evolving beyond traditional dashboards and static reporting systems. Modern enterprises no longer need platforms that simply visualize historical data — they need intelligent systems capable of analyzing, predicting, automating, and optimizing business operations in real time.
The rise of large language models, predictive analytics, AI agents, vector search, and autonomous workflows is transforming analytics into a continuously evolving decision-support ecosystem. Organizations are increasingly moving toward AI-powered platforms that can generate insights automatically, forecast future trends, detect anomalies, orchestrate workflows, and support conversational business intelligence at scale.
As enterprise data complexity continues to grow, the future of analytics will depend on combining multiple technologies into a unified intelligence architecture, including:
LLM-powered conversational analytics
Predictive machine learning systems
Automated reporting workflows
Real-time streaming intelligence
Explainable AI frameworks
Scalable cloud-native infrastructure
Agentic orchestration systems
Secure and privacy-preserving AI architectures
The enterprises adopting these technologies today are building faster, smarter, and more adaptive business intelligence ecosystems that can significantly improve operational efficiency, forecasting accuracy, and strategic decision-making.
Whether it’s building custom RAG engines, predictive dashboards, anomaly detection systems, federated learning platforms, or autonomous reporting pipelines, AI analytics is becoming a foundational capability for modern businesses.
Organizations looking to stay competitive should begin modernizing their analytics infrastructure with AI-first architectures designed for scalability, automation, and real-time intelligence.
If you're planning to build an enterprise AI analytics and reporting platform, custom business intelligence solution, or AI-powered automation workflow, this is the right time to explore scalable implementation strategies tailored to your business requirements.
From predictive analytics dashboards and intelligent reporting systems to RAG-based enterprise search and agentic AI workflows, modern AI analytics platforms can unlock entirely new levels of business intelligence and operational efficiency.
👉 Download the Free File:
If you're looking to build custom AI analytics and reporting platforms powered by LLMs, predictive analytics, RAG pipelines, AI agents, real-time dashboards, or intelligent automation workflows, feel free to reach out to Codersarts for development support, enterprise AI consulting, architecture design, and end-to-end implementation services tailored to your business needs.


Comments