Telco Churn Dataset - Classification & Clustering
- Nov 3, 2021
- 3 min read

Description :
The Telco customer churn data contains information about a fictional telco company that provided home phone and Internet services to 7043 customers in California in Q3. It indicates which customers have left, stayed, or signed up for their service. Multiple important demographics are included for each customer, as well as a Satisfaction Score, Churn Score, and Customer Lifetime Value (CLTV) index.
The data set includes information about:
Customers who left within the last month – the column is called Churn
Services that each customer has signed up for – phone, multiple lines, internet, online security, online backup, device protection, tech support, and streaming TV and movie
Customer account information – how long they’ve been a customer, contract, payment method, paperless billing, monthly charges, and total charges
Demographic info about customers – gender, age range, and if they have partners and dependents
Recommended Model :
Algorithms to be used: Decision Tree, Random Forest, Logistic Regression, KMeans, KNN etc.
Recommended Project :
Telecom Churn Prediction, Customer Segmentation.
Dataset link:
Overview of data
Detailed overview of dataset:
- Rows = 7043
- Columns= 21
Each row represents a customer, each column contains customer’s attributes described on the column Metadata.
customerID: A unique ID that identifies each customer.
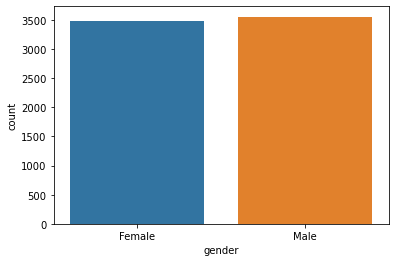
gender: The customer’s gender: Male, Female
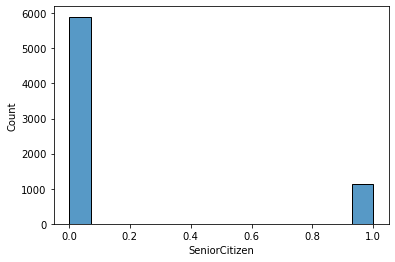
SeniorCitizen: Indicates if the customer is 65 or older: Yes, No
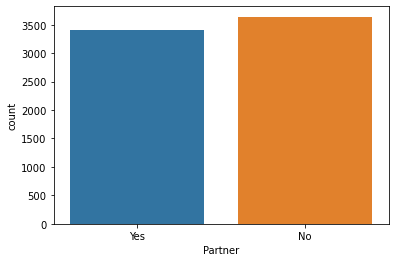
Partner: Indicate if the customer has a partner: Yes, No
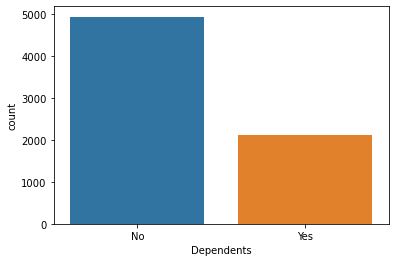
Dependents: Indicates if the customer lives with any dependents: Yes, No. Dependents could be children, parents, grandparents, etc.
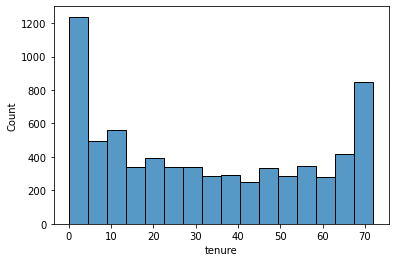
Tenure: Indicates the total amount of months that the customer has been with the company by the end of the quarter specified above.
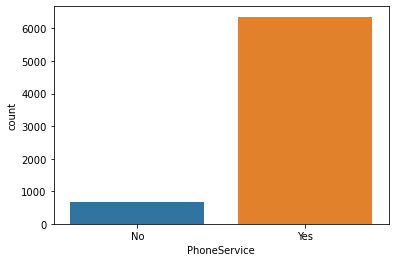
PhoneService: Indicates if the customer subscribes to home phone service with the company: Yes, No
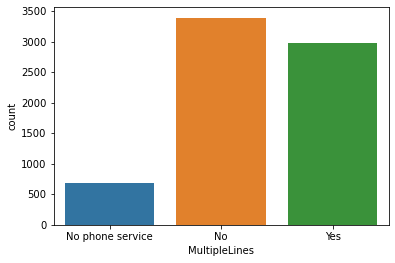
MultipleLines: Indicates if the customer subscribes to multiple telephone lines with the company: Yes, No
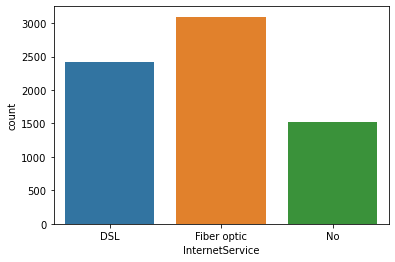
InternetService: Indicates if the customer subscribes to Internet service with the company: No, DSL, Fiber Optic, Cable.
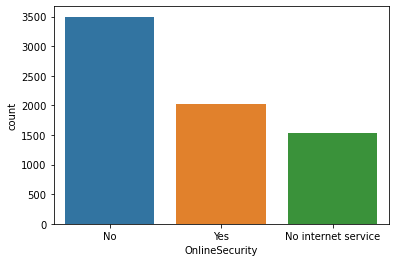
OnlineSecurity: Indicates if the customer subscribes to an additional online security service provided by the company: Yes, No
OnlineBackup: Indicates if the customer subscribes to an additional online backup service provided by the company: Yes, No
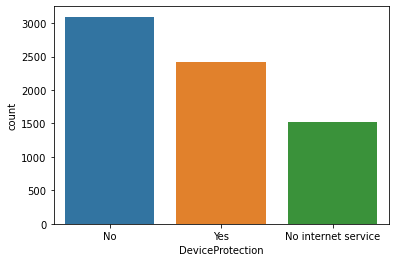
DeviceProtection: Indicates if the customer subscribes to an additional device protection plan for their Internet equipment provided by the company: Yes, No
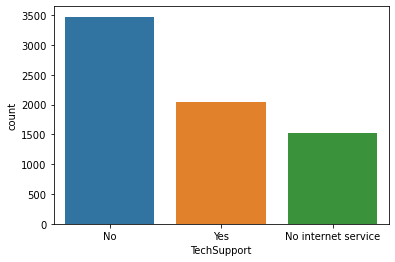
TechSupport: Indicates if the customer subscribes to an additional technical support plan from the company with reduced wait times: Yes, No
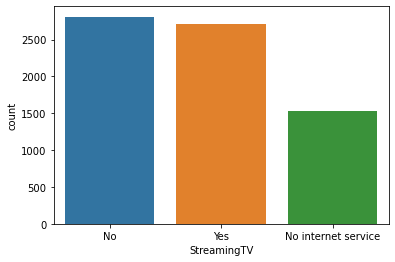
StreamingTV: Indicates if the customer uses their Internet service to stream television programing from a third party provider: Yes, No. The company does not charge an additional fee for this service.
StreamingMovies: Indicates if the customer uses their Internet service to stream movies from a third party provider: Yes, No. The company does not charge an additional fee for this service.
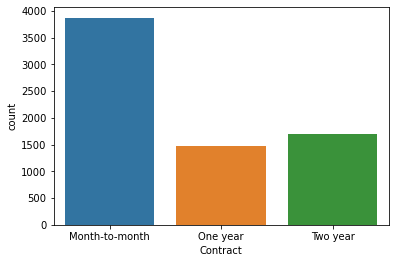
Contract: Indicates the customer’s current contract type: Month-to-Month, One Year, Two Year.
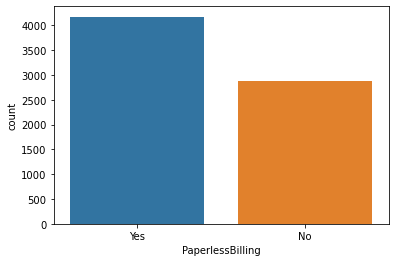
PaperlessBilling: Indicates if the customer has chosen paperless billing: Yes, No
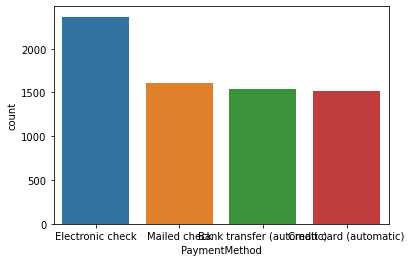
PaymentMethod: Indicates how the customer pays their bill: Bank Withdrawal, Credit Card, Mailed Check
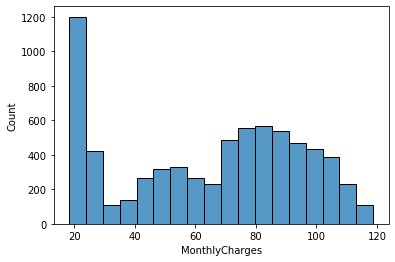
MonthlyCharge: Indicates the customer’s current total monthly charge for all their services from the company.
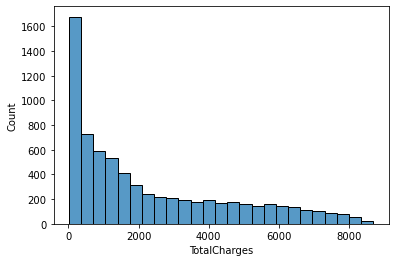
TotalCharges: Indicates the customer’s total charges, calculated to the end of the quarter specified above.
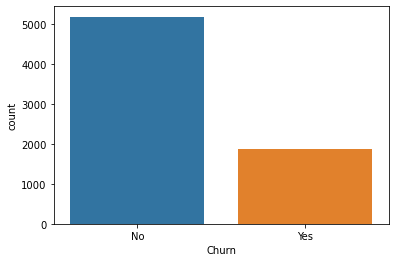
Churn: Yes = the customer left the company this quarter. No = the customer remained with the company. Directly related to Churn Value.
EDA [CODE]
import pandas as pd
# load data data = pd.read_csv('telecom.csv')
data.head()
# check details of the dataframe
data.info()
# check the no.of missing values in each column

data['TotalCharges'] = pd.to_numeric(data['TotalCharges'], errors = 'coerce') # change TotalCharges to numeric dtype

data.isna().sum()
# statistical information about the dataset
data.describe()
# statistical information about the dataset
data.describe(include = 'object)
# data distribution

import seaborn as sns
import matplotlib.pyplot as plt


num_cols = data.select_dtypes(['int64','float64']).columns
cat_cols = data.select_dtypes('object').columns

for i in num_cols:
    sns.histplot(data[i], kde=False)
    plt.show()

for i in cat_cols:
    if i!= 'customerID':
        sns.countplot(x = i, data = data)
        plt.show()


Other datasets for classification:
Credit Card Fraud Dataset
If you need implementation for any of the topics mentioned above or assignment help on any of its variants, feel free to contact us


Comments