Multiple Views and Interactive 2D Graphics - JavaFx Assignment
- Nov 5, 2020
- 6 min read
Updated: Oct 3, 2021
In this assignment you will build a JavaFX system that demonstrates your skills with Model-View-Controller and multiple views, 2D graphics, and interaction with graphical objects. The application, called CriticalPath, allows users to create a dependency graph for a project and see the critical path from project start to project completion. A dependency graph is a directed acyclic graph (DAG) where the nodes are activities in the project, and edges connect activities in terms of their time dependencies. For example, a dependency graph for the task of making a cheese sandwich might be as follows (note that we assume unlimited workers to carry out the tasks, meaning that all branches can be carried out in parallel):
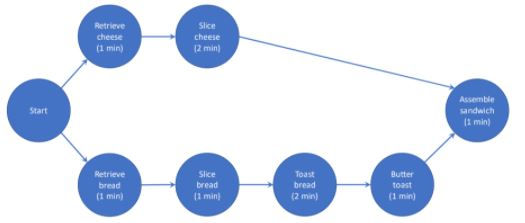
The critical path is the path through the graph that requires the most total time, and so indicates the total time that will be needed to complete the project. Since the “toast” path in the graph requires 6 minutes (and the “cheese” path requires only 4 minutes), the toast path is the critical path. (Note that critical path is calculated only based on time, and does not care about the number of nodes in the path).
The assignment has 3 parts: Part 1 involves the main UI for creating and working with the graph, Part 2 involves additional views and navigation, and Part 3 involves graph operations.
Part 1. Main graph UI
The main panel for the system shows the graph and allows the user to interact with it (i.e., creating and deleting nodes and edges, dragging nodes on the workspace). The system uses an MVC architecture as specified below.
Interaction requirements:
The graph view shows a graphical representation of the graph, with nodes as coloured circles (with titles and time costs), and edges as arrows between the nodes
The user can create a new node by right-clicking the mouse (pressing + releasing) on the background. When a new node is created, it has the default title “Activity” and the default time cost 1.0
The user can select a node by pressing the left mouse button on the node; selection is indicated in the view by drawing the node with a dashed outline and a different fill colour.

The user can move a node by pressing the left mouse button on a node and then dragging the mouse. (This also selects the node)
Selection is persistent (i.e., the node stays selected even after a move is completed)
The user can delete a node by selecting it and then pressing the Delete key on the keyboard
The user can create an edge by right-clicking on the start node, dragging to the end node, and releasing the mouse button. As the user drags the mouse, a temporary line is shown from the start node to the mouse cursor; when the mouse is released on the end node, the edge is created and shown. If the user releases when the cursor is not on a node, the temporary line is discarded and no edge is created.
Edges show arrowheads to indicate the direction of the edge
The user can select an edge by left-clicking on it (within a small “close enough” region as described in lectures); a selected edge is shown using a dashed line
The user can delete an edge by selecting it and then pressing the Delete key on the keyboard
Selecting any node or edge removes any previous selection. There is no multiple selection.
When the application starts, the graph contains a single node titled “Start”, with a time cost of 0.0. This is the root node for calculation of the critical path, and cannot be deleted or edited (however, it can be dragged). Code requirements:
Create class MainGraphView to show the graph
o The view must use immediate-mode graphics in JavaFX (i.e., a Canvas)
o The view should use 2D transforms to position the graphics reference frame before drawing nodes, edges, and arrowheads
Create class GraphModel to store the graph
o Create classes Node and Edge that will be used by the model
o GraphModel must use publish-subscribe communication to the view
o GraphModel must have a public API that can be called by the controller
o The model must store locations as normalized coordinates
Create class GraphViewController to handle user events from the MainGraphView
o The controller must implement a state machine to handle mouse events from the MainGraphView
o Note: when you set up event handling in MainGraphView, normalize the mouse coordinates before they are sent to the controller (as shown in the lab example).
Create class InteractionModel to store view state including node and edge selection Resources for Part 1
The BoxDemo code and the graphics demos available in the Code Examples folder on the course website
JavaFX APIs for Canvas and GraphicsContext: openjfx.io/javadoc/15/
Result for Part 1: a zipped IDEA project that meets the interaction and code requirements above. To export your project, choose File > Export > Project to Zip file. NOTE: if you have fully completed Part 2, do not hand in a project for Part 1.
Part 2. Additional views and viewport navigation
In Part 2 you will create additional views for the CriticalPath app, and will implement panning and zooming capability. There will be two new views of the graph (a view of a single node’s details, and an overview of the entire workspace), and you will combine these and your existing graph view into a new composite view that holds the entire UI.
MainGraphView: new interaction requirements
The graph is now shown on a square workspace that may be larger than the MainGraphView’s canvas, and therefore the MainGraphView now shows a viewport onto the workspace. For example, the workspace might be 2000x2000, and a 500x500 MainGraphView will show one quarter of the workspace.
The viewport can now be panned: when the user presses on the background (either mouse button) and drags, the view will pan by the amount of the drag.
Panning is restricted to the size of the workspace (i.e., the left/top of the MainGraphView can never go past 0,0 in the workspace, and the right/bottom of the MainGraphView can never go past the workspace extents)
If the window is resized, the size of the MainGraphView canvas changes, but not the size of the workspace.
MainGraphView: new code requirements
Add variables to MainGraphView to store the size of a logical workspace that can be different from the size of the MainGraphView. (You may wish to also store the workspace size in the InteractionModel)
Use the width and height of the workspace as the extents for normalizing coordinates (i.e., divide the mouse X and Y by the workspace width and height, rather than the MainGraphView width and height)
Add viewportLeft and viewportTop variables to the InteractionModel to store the left and top coordinates of the viewport within the workspace
When you draw the graph in the MainGraphView, subtract viewportLeft and viewportTop from your translations in order to draw the correct content in the MainGraphView. For example, assume the workspace is 2000x2000 and the MainGraphView is 500x500. Assume a Node has location 0.5, 0.5 in the workspace, and that the viewport is at viewportLeft 0.4 and viewportTop 0.4. The Node should be therefore be drawn in the MainGraphView at x = (0.5 - 0.4) * 500 and y = (0.5 - 0.4) * 500.
NodeDetailView:
Create class NodeDetailView to show the name and time cost for a selected node
Lay out the components of NodeDetailView as shown in the picture
If no node is selected, this view should show blanks for both name and time
The text fields in the NodeDetailView are editable: if the user enters a new name and presses Return, or enters a new cost and presses Return, the selected node will be updated with the new values. (Note that using Return to generate an event in a TextField can be done with the setOnAction() method.)
If the user attempts to edit the Start node, the values return to their defaults (“Start” and 0.0) MiniGraphView:
Create class MiniGraphView to show an overview of the entire workspace
The mini view should be very similar to the MainGraphView, with the following changes:
o The mini view is 200x200 pixels, and does not change size
o The mini view always shows the entire workspace
o The mini view shows the MainGraphView’s viewport as a transparent grey rectangle
o There are no user interactions with the mini view.
You may wish to create an inheritance hierarchy to avoid duplicating code for the two graph views (e.g., MainGraphView and MiniGraphView both extend abstract GraphView)
Composite app view:
Create class MainAppView that will hold your other views and additional controls
Lay out the views inside MainAppView as shown in the picture
Add a panel “View Controls” between the mini view and the node view
o The view controls should show a slider with extents [0.25..2.0]
o Dragging the slider changes the zoom level in the MainGraphView (and also changes the size of the viewport rectangle in the mini view). Add a variable zoomLevel to InteractionModel to store this value.
Contact us to get JavaFx visualization assignment help with an affordable price at contact@codersarts.com


Comments