Machine Learning Project Help - Creating Customer Segments
Implement Machine Learning Customer segment using Python
Introduction
One goal of this project is to best describe the variation in the different types of customers that a wholesale distributor interacts with.
Import all Libraries which is necessary for this
# Import libraries
import numpy as np
import pandas as pd
import renders as rs
from IPython.display import display
%matplotlib inline
# Load the wholesale customers dataset
try:
    data = pd.read_csv("customers.csv")
    data.drop(['Region', 'Channel'], axis = 1, inplace = True)
    print("Wholesale customers dataset has {} samples with {} features
    each.".format(*data.shape))
except:
    print("dataset missing?")
Output:
Wholesale customers dataset has 440 samples with 6 features each.
Data Exploration
In this dataset have six important product categories: 'Fresh', 'Milk', 'Grocery', 'Frozen', 'Detergents_Paper', and 'Delicatessen'
FRESH: annual spending (m.u.) on fresh products (Continuous)
MILK: annual spending (m.u.) on milk products (Continuous)
GROCERY: annual spending (m.u.) on grocery products (Continuous)
FROZEN: annual spending (m.u.)on frozen products (Continuous)
DETERGENTS_PAPER: annual spending (m.u.) on detergents and paper products (Continuous)
DELICATESSEN: annual spending (m.u.) on and delicatessen products (Continuous)
Describe the dataset
# Display a description of the dataset
stats = data.describe()
stats
Output:

Selecting Samples
Here we use simple logic to selecting some features.
# Using data.loc to filter a pandas DataFrame
data.loc[[100, 200, 300],:]
Output:

Retrieve the Columns
data.columnsOutput:
Index(['Fresh', 'Milk', 'Grocery', 'Frozen', 'Detergents_Paper', 'Delicatessen'], dtype='object')
Logic in selecting the 3 samples: Quartiles
Selecting Fresh features which is less than the value of fresh_q1
# Fresh filter
fresh_q1 = 3127.750000
display(data.loc[data.Fresh < fresh_q1, :].head())
Output:

Selecting the Frozen
Here simple logic to select the Frozen which is less than frozen_q1
# Frozen filter
frozen_q1 = 742.250000
display(data.loc[data.Frozen < frozen_q1, :].head())
Output:

Selecting the Frozen with greater values
Here selecting the Frozen which is greater than the frozen_q3
# Frozen
frozen_q3 = 3554.250000
display(data.loc[data.Frozen > frozen_q3, :].head(7))
Output:

Selecting the simple data and reset the index
Here we write the simple code in which we can choose the simple indices and then reset the index.
# TODO: Select three indices of your choice you wish to sample from the dataset
indices = [43, 12, 39]
# Create a DataFrame of the chosen samples
samples = pd.DataFrame(data.loc[indices], columns = data.columns).reset_index(drop = True)
print("Chosen samples of wholesale customers dataset:")
display(samples)
Output:

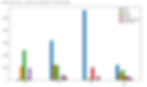
Comparison of Samples and Means
# Import Seaborn, a very powerful library for Data Visualisation
import seaborn as sns
# Get the means
mean_data = data.describe().loc['mean', :]
# Append means to the samples' data
samples_bar = samples.append(mean_data)
# Construct indices
samples_bar.index = indices + ['mean']
# Plot bar plot
samples_bar.plot(kind='bar', figsize=(14,8))
Output:
Finding the R2 score of all the features
We can find r2-score for all the features:
dep_vars = list(data.columns)
for var in dep_vars:
   new_data = data.drop([var], axis = 1)
   # Create feature Series (Vector)
   new_feature = pd.DataFrame(data.loc[:, var])
   X_train, X_test, y_train, y_test = train_test_split(new_data, new_feature,
   test_size=0.25, random_state=42)
   dtr = DecisionTreeRegressor(random_state=42)
   # Fit
   dtr.fit(X_train, y_train)
   score = dtr.score(X_test, y_test)
   print('R2 score for {} as a dependent variable: {}'.format(var, score))
Output:
R2 score for Fresh as a dependent variable: -0.38574971020407384 R2 score for Milk as a dependent variable: 0.15627539501732116 R2 score for Grocery as a dependent variable: 0.6818840085440834 R2 score for Frozen as a dependent variable: -0.21013589012491396 R2 score for Detergents_Paper as dependent variable: 0.27166698062685013 R2 score for Delicatessen as a dependent variable: -2.254711537203931
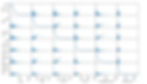
Scatter matrix plot for all the features
# Produce a scatter matrix for each pair of features in the data
from pandas.plotting import scatter_matrix
scatter_matrix(data, alpha = 0.3, figsize = (14,8), diagonal = 'kde')
Output:
Get your project or assignment completed by Deep learning expert and experienced developers and researchers.
OR
If you have project files, You can send at codersarts@gmail.com directly